Cover illustration

TheDaily Front

Issue No. #260930 Wednesday, September 30 2026 #260930 — WEDNESDAY, SEPTEMBER 30, 2026
Frontier models, old machinery, and the stubborn business of making sense of both.
Wednesday, September 30, 2026 The Daily Front No. #260930 — Contents
30stories
6,313points
4,430comments
250kllm tokens
Assembled with 33 model calls — 167,288 tokens read, 82,248 written.

Highlights

Gemini 4 Argon

Google unveils Gemini 4 Argon, promising deep-reasoning performance while keeping the model behind an early-access curtain.

September 2026: The world today, as seen by one Polish guy

A Polish observer traces how war, fuel, food, debt, and winter heating have become one inseparable crisis.

EDG C++ front-end goes public

After decades inside the compiler industry, EDG’s influential C++ front end enters the open-source world.

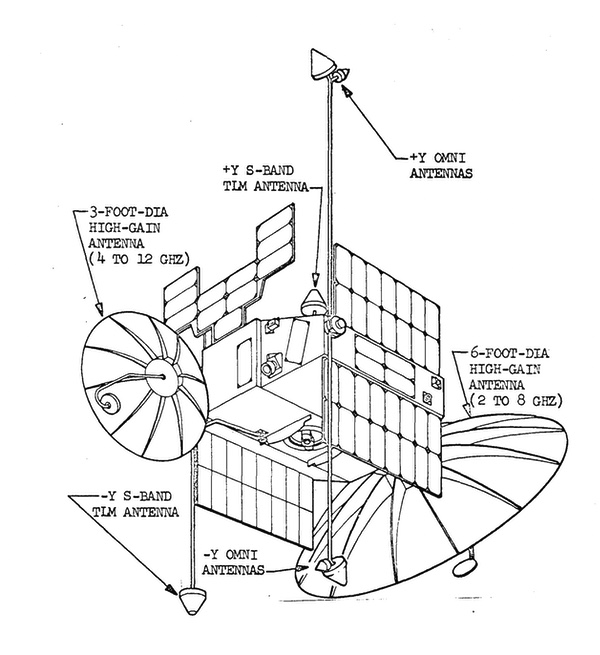
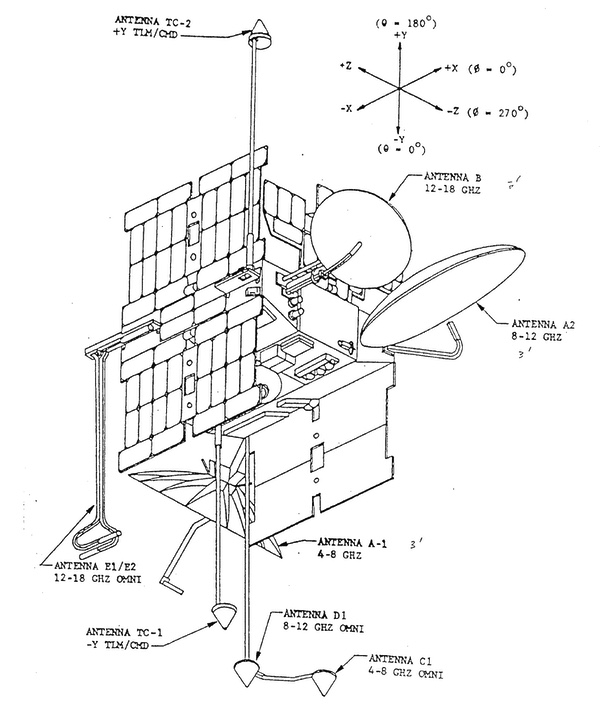
The top secret URSALA, RAQUEL, and FARRAH satellites (2025)

A richly illustrated history follows America’s long-secret hitchhiker satellites from Cold War reconnaissance to the present.

Singapore govt dating app uses Gale-Shapley stable marriage algorithm

Singapore’s state-backed dating experiment brings the stable-marriage algorithm to a distinctly modern civic problem.

From the Editor

The machine news arrived in force today: new models, new arguments, and old institutions trying to decide who ought to hold the controls. Elsewhere, the day’s most durable stories concerned systems—markets, satellites, compilers, courts, and families—and the people obliged to live inside them.

  1. Gemini 4 Argon3
  2. You said no MCP4
  3. September 2026: The world today, as seen by one Polish guy5
  4. The AI Race Just Got Awkward6
  5. Why Is Sam Altman a Free Man?7
  6. A brief history of the Bloomberg terminal8
  7. EDG C++ front-end goes public9
  8. The top secret URSALA, RAQUEL, and FARRAH satellites (2025)10
  9. What TLA+ can and can't check11
  10. Tesla takes on $30B in credit as it approaches unprofitability12
  11. LinkedIn Larpmaxxing13
  12. SDF vs. MSDF vs. Slug: GPU Text Rendering14
  13. Surprisingly complex waves reveal the brain's inner workings15
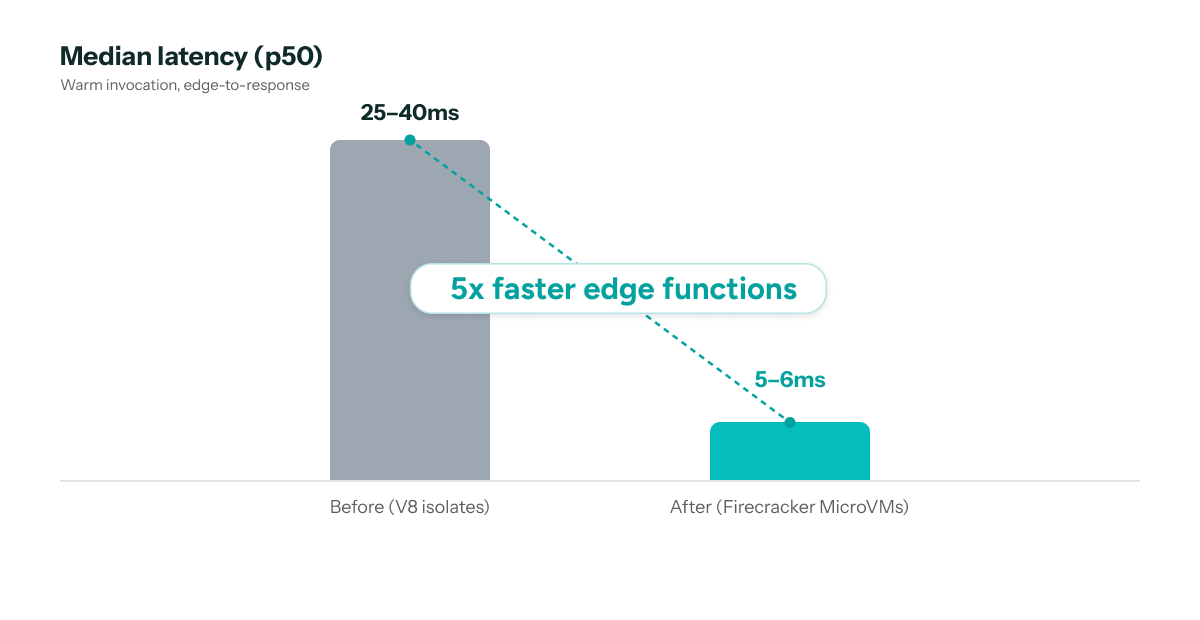
  14. 5x faster Edge Functions: V8 isolates to Firecracker MicroVMs16
  15. CS240 AI Cheating Retrospective17
  16. Gemini 4 Argon (High): Intelligence, Performance and Price Analysis18
  17. Halfspace experimental IDE for solid modeling with distance fields19
  18. Dear Software Makers20
  19. PSSA: A non-transformer language model written from scratch in Rust21
  20. Responsible Release of AI-Generated Mathematics22
  21. Singapore govt dating app uses Gale-Shapley stable marriage algorithm23
  22. Launch HN: Magnitude (YC S25) – Self-optimizing inference engine for agents24
  23. Most data centers refusing to say how much water, electricity they use25
  24. The last time my family was replaced by technology26
  25. RSS Feeds for Last.fm27
  26. Commit description as a thinking tool28
  27. Ballmer Peak29
  28. 56k.rip – the 1996 dial-up internet experience30
  29. America.gov goes crazy on "play Minecraft"30
  30. SDF Public Access Unix System ... est. 198730
The Daily Front Page 2 of 31
Wednesday, September 30, 2026 The Daily Front No. #260930 — The Argon Announcement
article

Gemini 4 Argon

by bradleyg223·▲ 1,132 points·752 comments·blog.google ↗
Gemini 4 Argon delivers frontier performance in complex workflows.

Stylized promotional blog key art graphic with modern editorial branding and the text "Gemini 4 Argon"

Gemini 4 Argon delivers frontier performance in complex workflows across real-world software engineering, enterprise knowledge work like legal and finance, and cybersecurity defense.

Today, we’re announcing our new frontier model, Gemini 4 Argon, which is rolling out to a set of trusted cyber defenders through our Fairwind Program. Built to sustain deep reasoning across complex, long-horizon workflows, Argon is fundamentally changing the way we work and build at Google. It delivers frontier performance in complex workflows across real-world software engineering, enterprise knowledge work like legal and finance, and cybersecurity defense.

Safely releasing frontier capabilities at this level requires a phased approach. We are actively engaged in the U.S. government’s voluntary process for pre-release model access while we gradually expand access. We’ll continue to gather feedback from early testers as we iterate on guardrails before making Argon available to developers, enterprises, and consumers as soon as possible.

Argon will launch at an introductory price 1 of $2 per million input tokens and $10 per million output tokens, with cached input tokens priced at 95% off input token price.

Changing how we work and build at Google

Gemini 4 Argon is already powering our internal workflows, with thousands of Googlers highlighting the model’s strengths in specialized coding tasks, conducting deeper research, and writing quality. It’s helping teams build faster and push the boundaries of engineering productivity and accelerating breakthroughs:

  • Quantum algorithmic optimization: Argon is helping our quantum computing researchers optimize the spacetime resources (qubits × gates) of subroutines that bottleneck important applications. In one example, it beat the published baseline by 40% in a matter of minutes.

  • Memory efficiency: A team of Argon agents analyzed fleet-wide profiling telemetry to autonomously identify and apply memory optimizations across Google’s data centers, freeing up over 300 TiB of memory once rolled out, with an estimated 500 TiB to 1 PiB in total savings.

  • Large Scale Codebase Migrations and Optimizations: Argon agents are working on migrating C/C++ codebases to Rust across Google — scaling from tens of thousands of lines in core libraries like re2, libgav1 up to 800K+ lines for the Fuchsia Zircon kernel. Given the criticality of many of these systems, such large-scale rewrites are undergoing rigorous automated and manual auditing, emulation testing, and review before rolling out to production.

    For libgav1, Google's open source software for decoding video, Argon agents took an existing Rust port and replaced 32K lines of SIMD code by running many rounds of profile-guided experiments, studying the compiler's output, producing safe Rust so the compiler would vectorize it automatically. The end result is a memory-safe video decoder that runs 2.7x faster than the Rust port, with identical video output, bringing it closer to the optimized C++.

Working harder on your most complex problems

To support Gemini 4 Argon’s capabilities across longer, more complex use cases, we are significantly expanding the model’s output token limit to an industry-leading 1M tokens, up from the previous 64K tokens. When the model has the headroom to think deeply and generate hundreds of thousands of tokens in a single trajectory, it adds a new level of depth in reasoning to solve tough problems in one go.

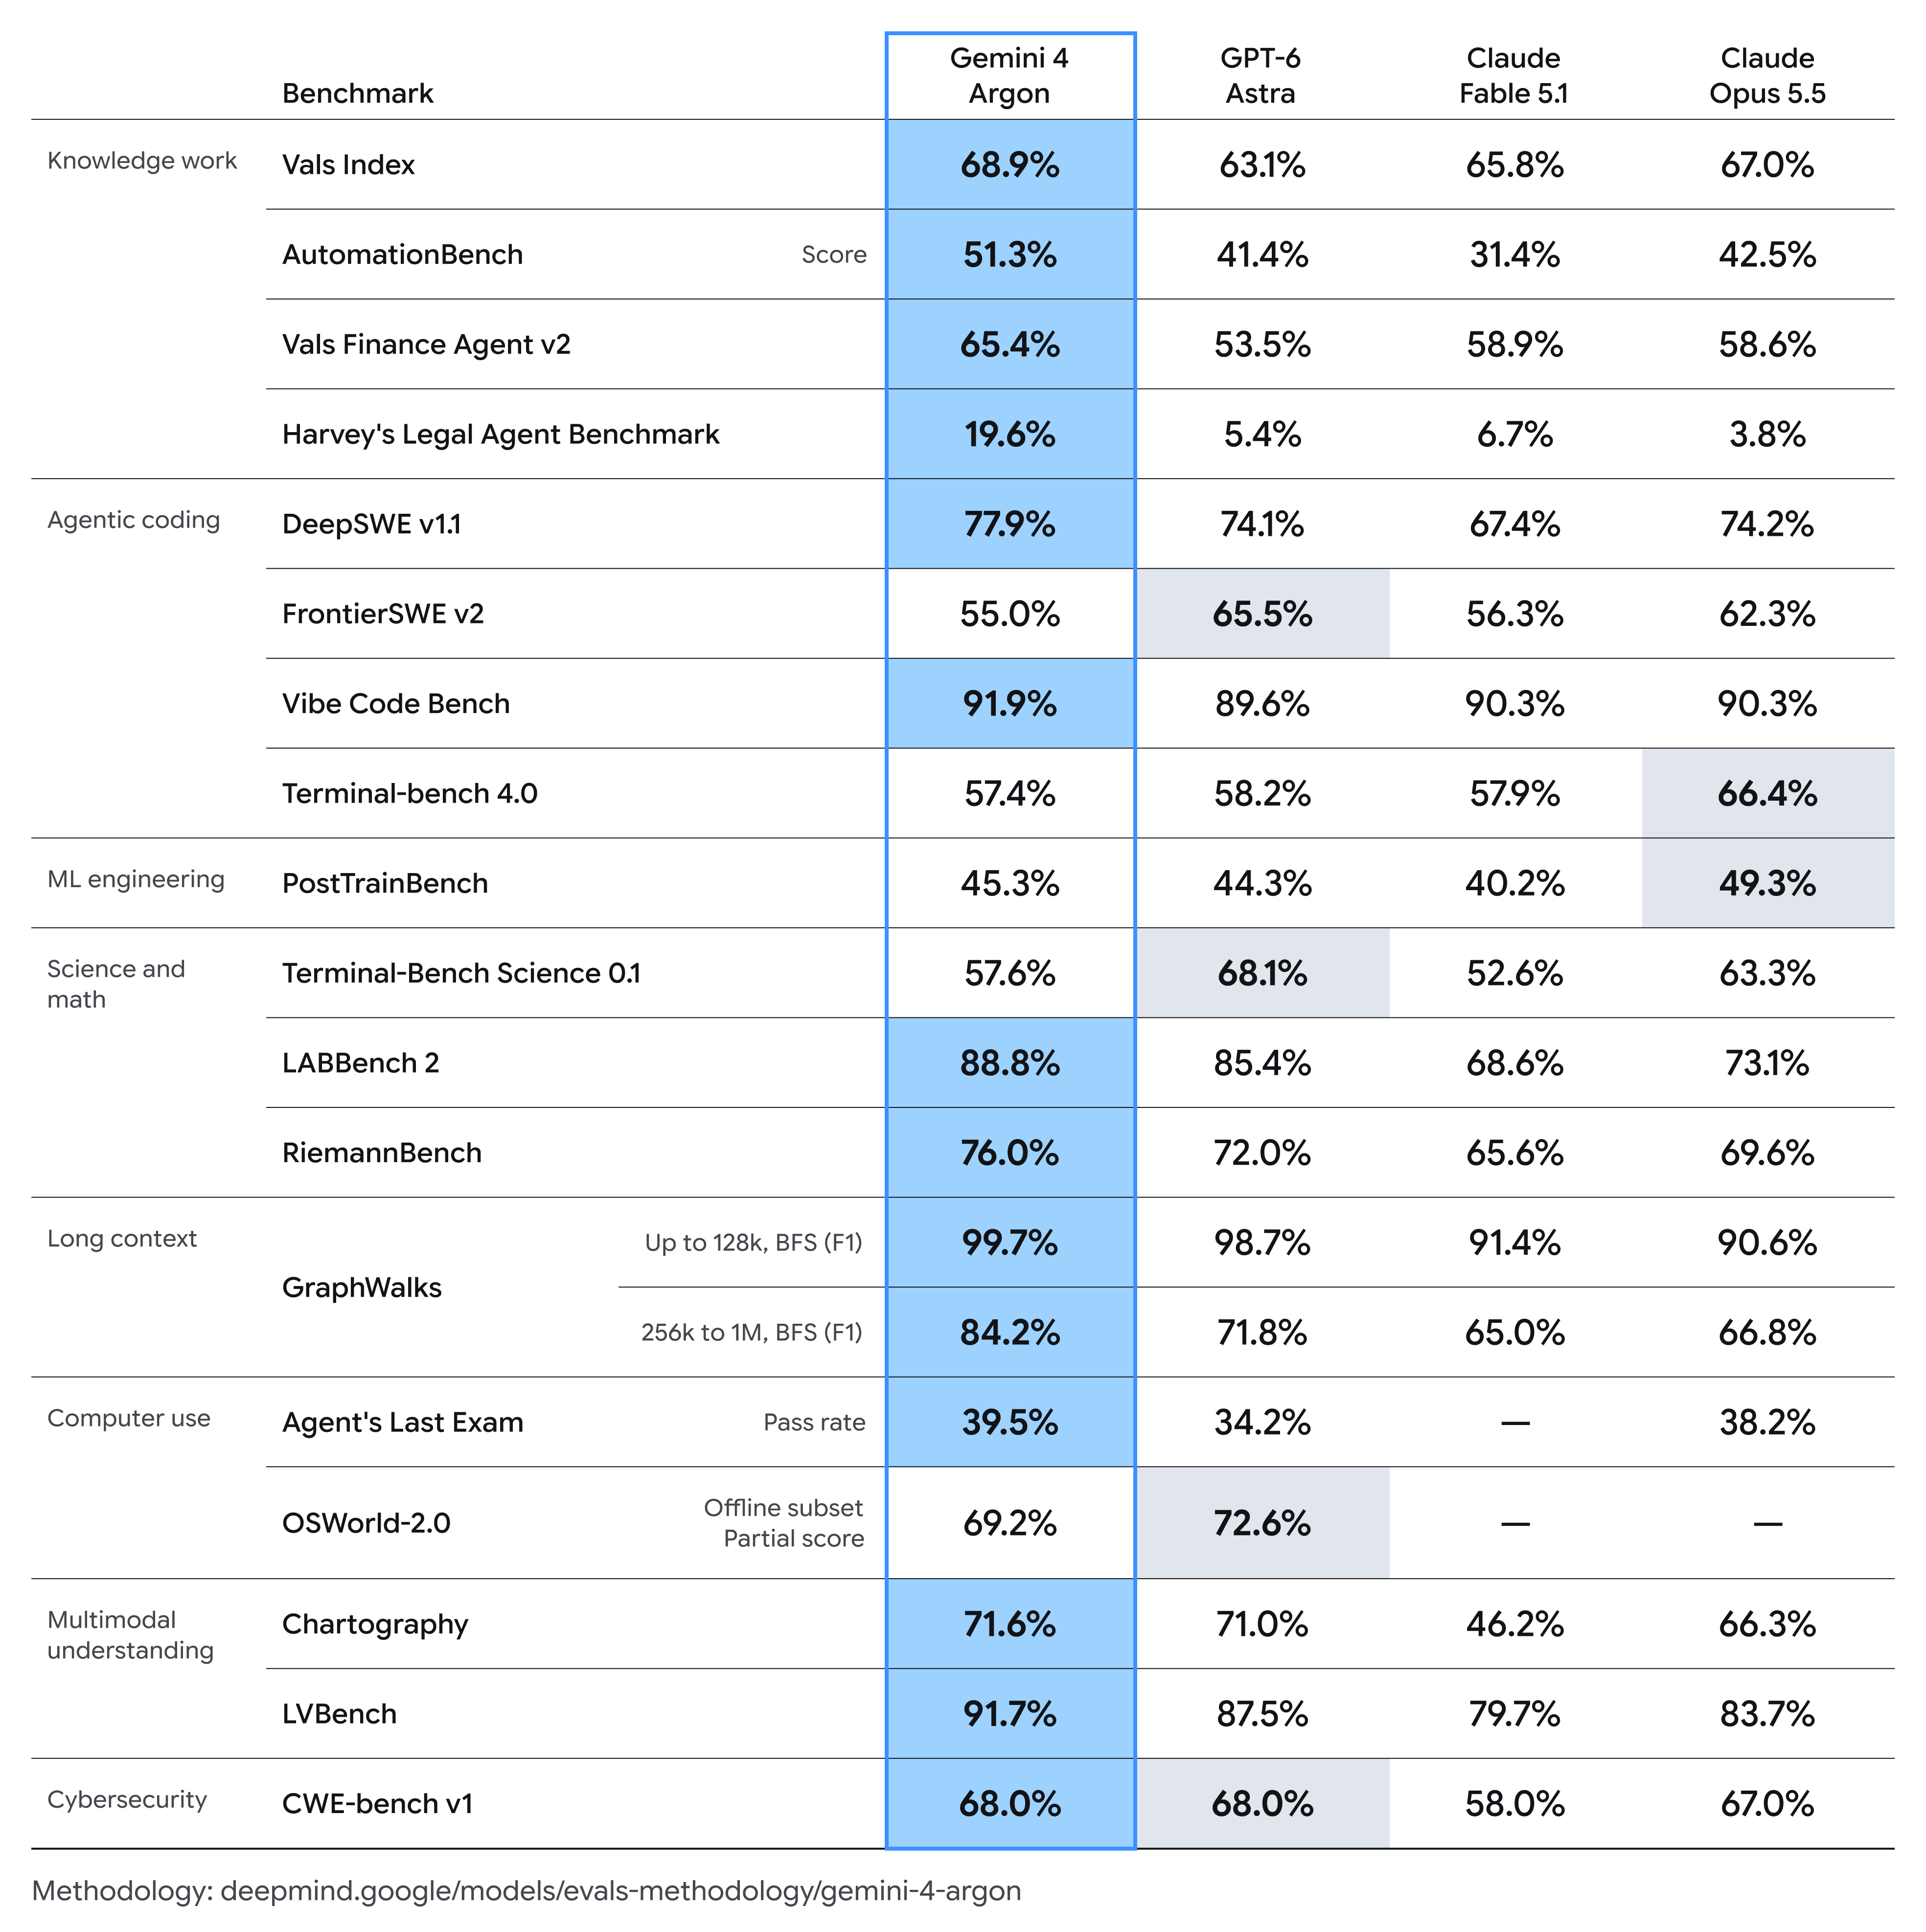
a benchmark chart showing Gemini 4 Argon capabilities

Enabling coding and enterprise workflows across domains

Gemini 4 Argon’s capabilities across coding, reasoning, and multimodality and its ability to sustain long, multi-step tasks enable it to excel across a range of enterprise workflows.

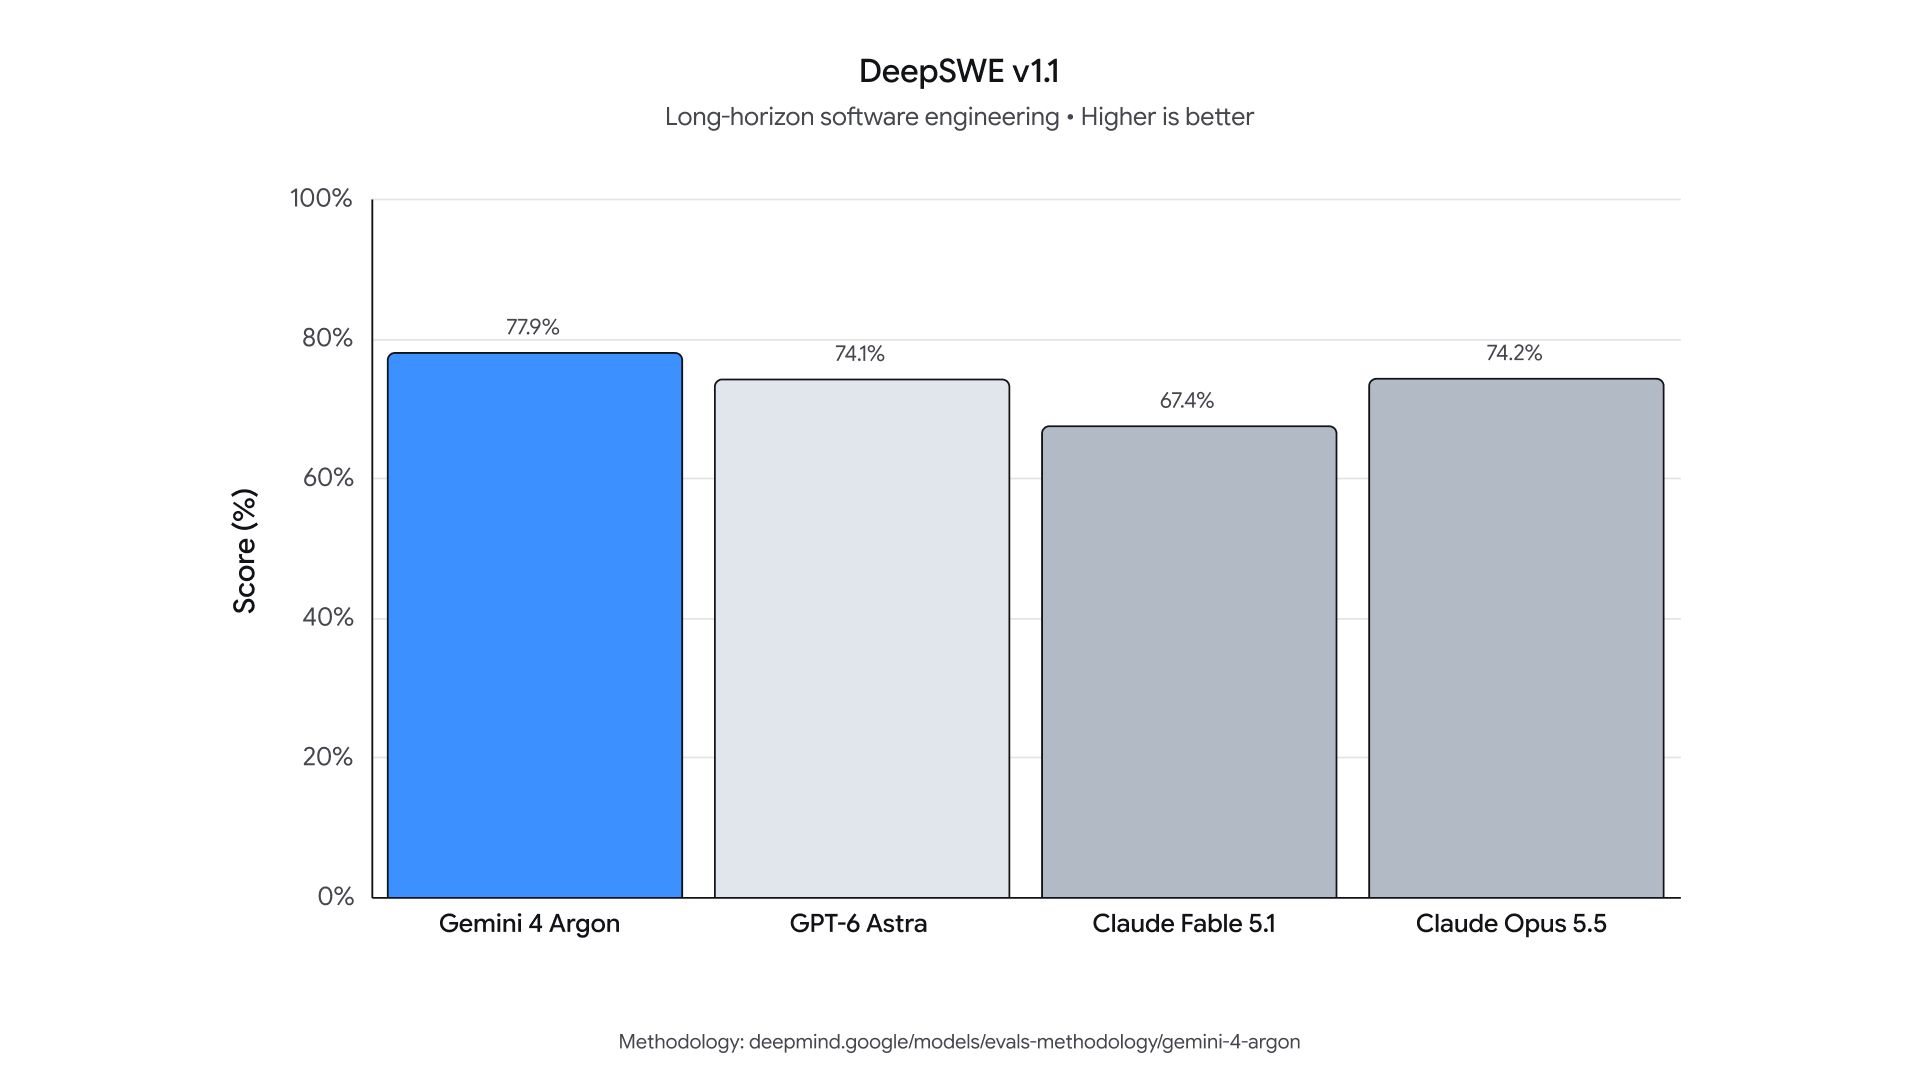
Google engineers have been using Argon for their daily tasks, from everyday debugging to large-scale codebase migrations and algorithm designs. It sets a new state of the art on DeepSWE v1.1 (77.9%), which measures a model’s performance in real-world long-horizon software engineering tasks.

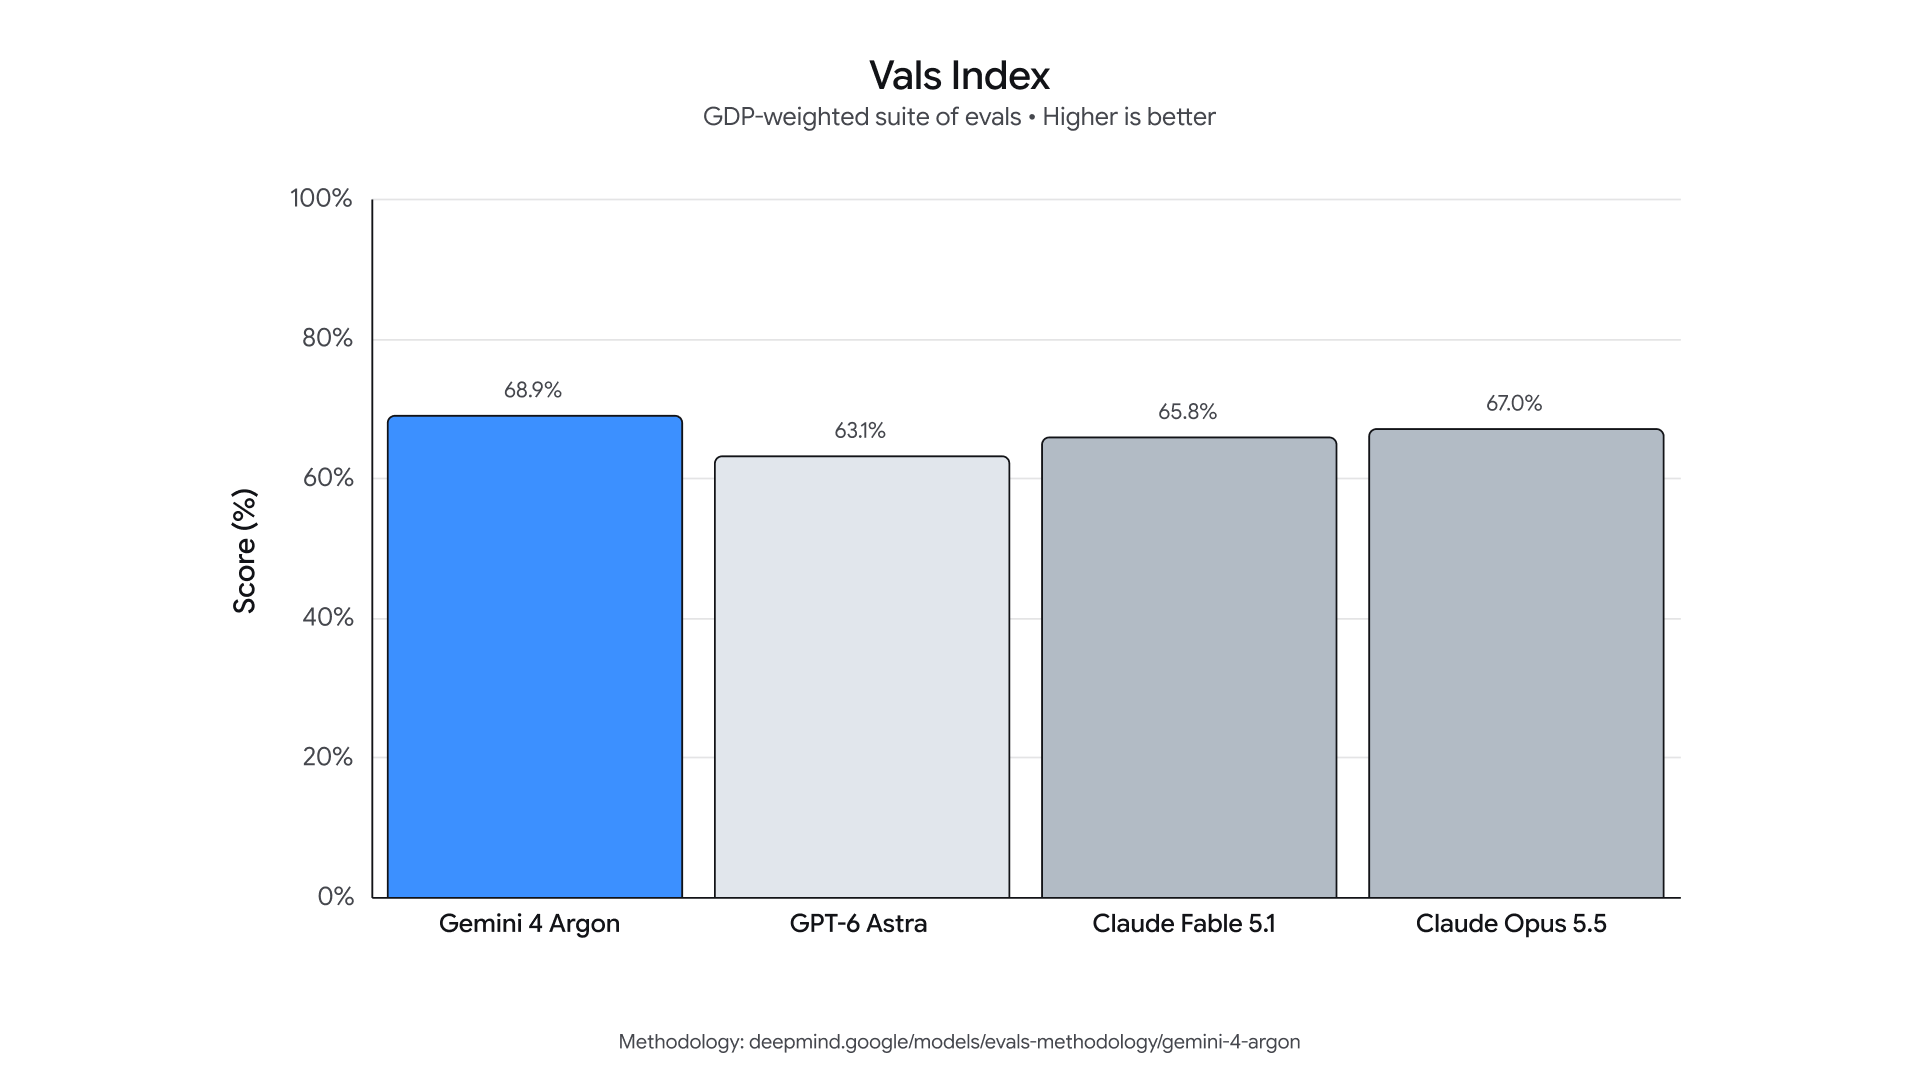
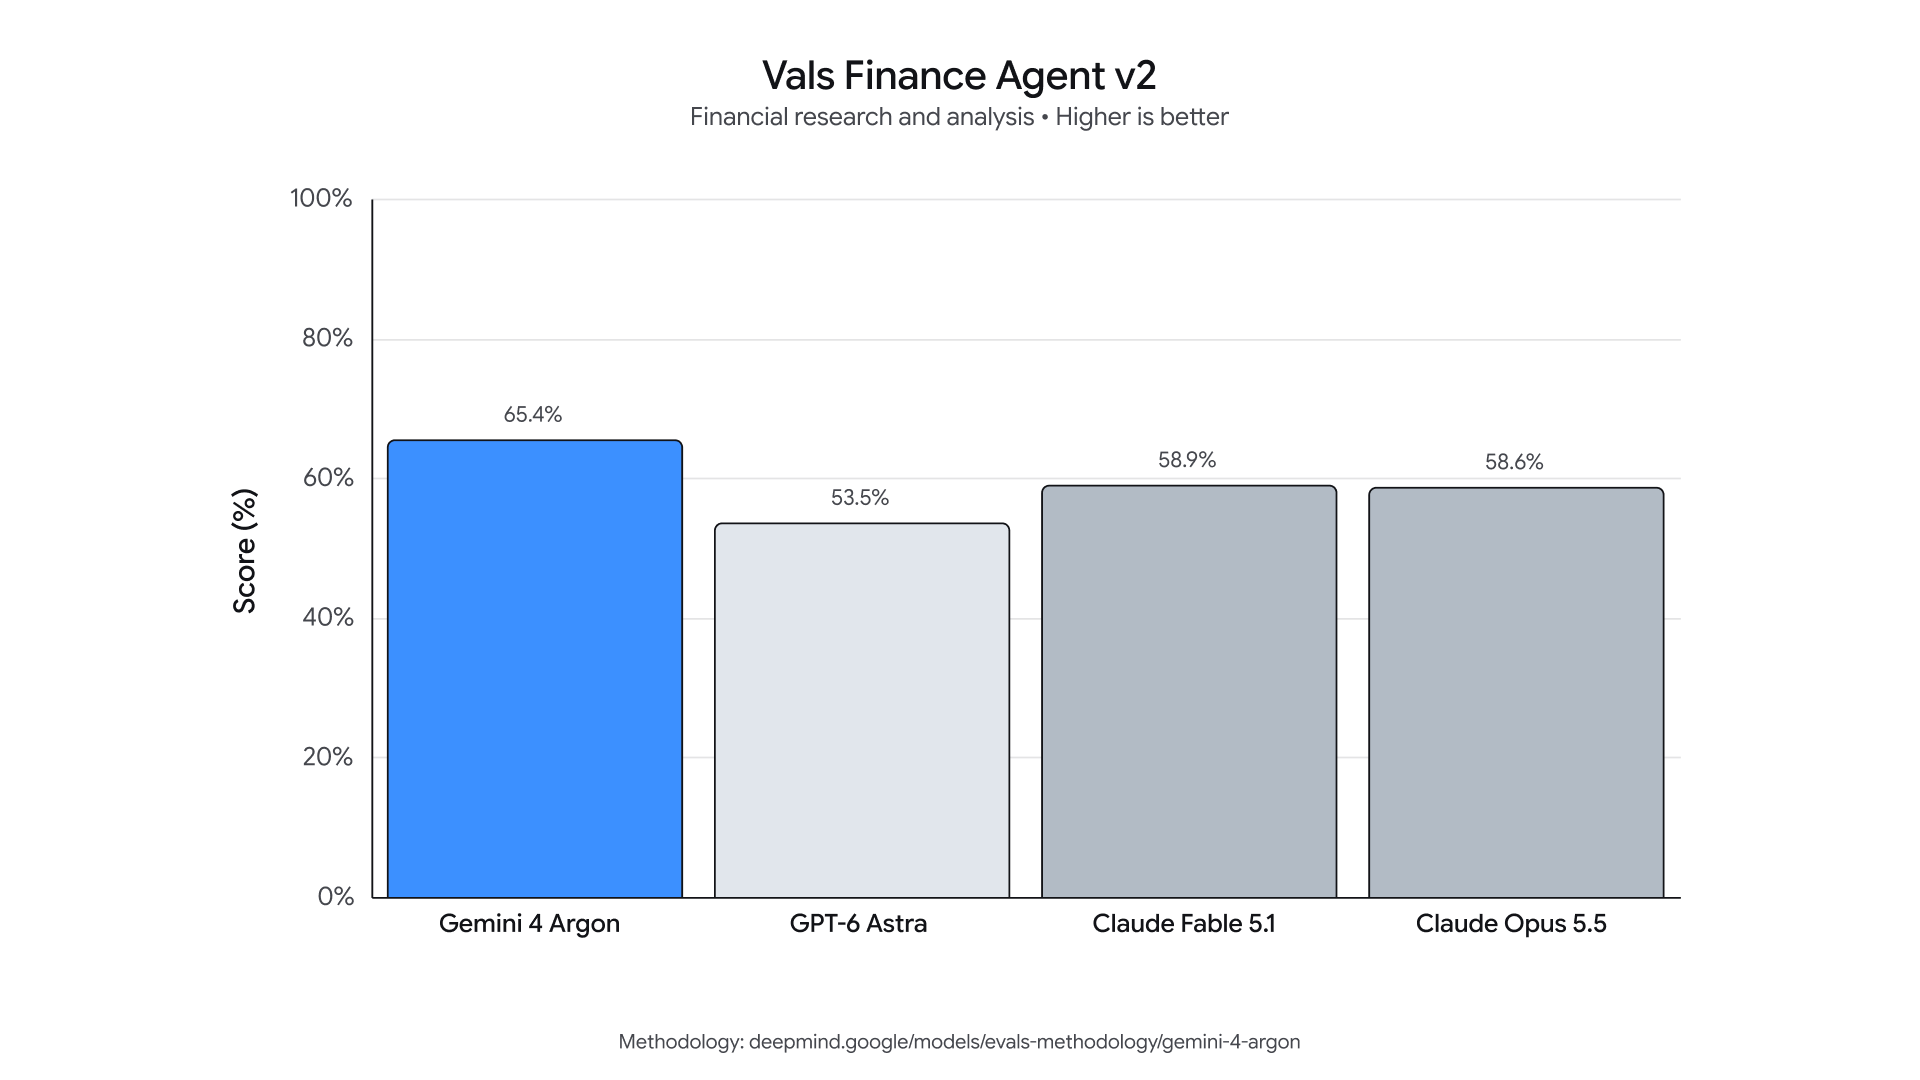
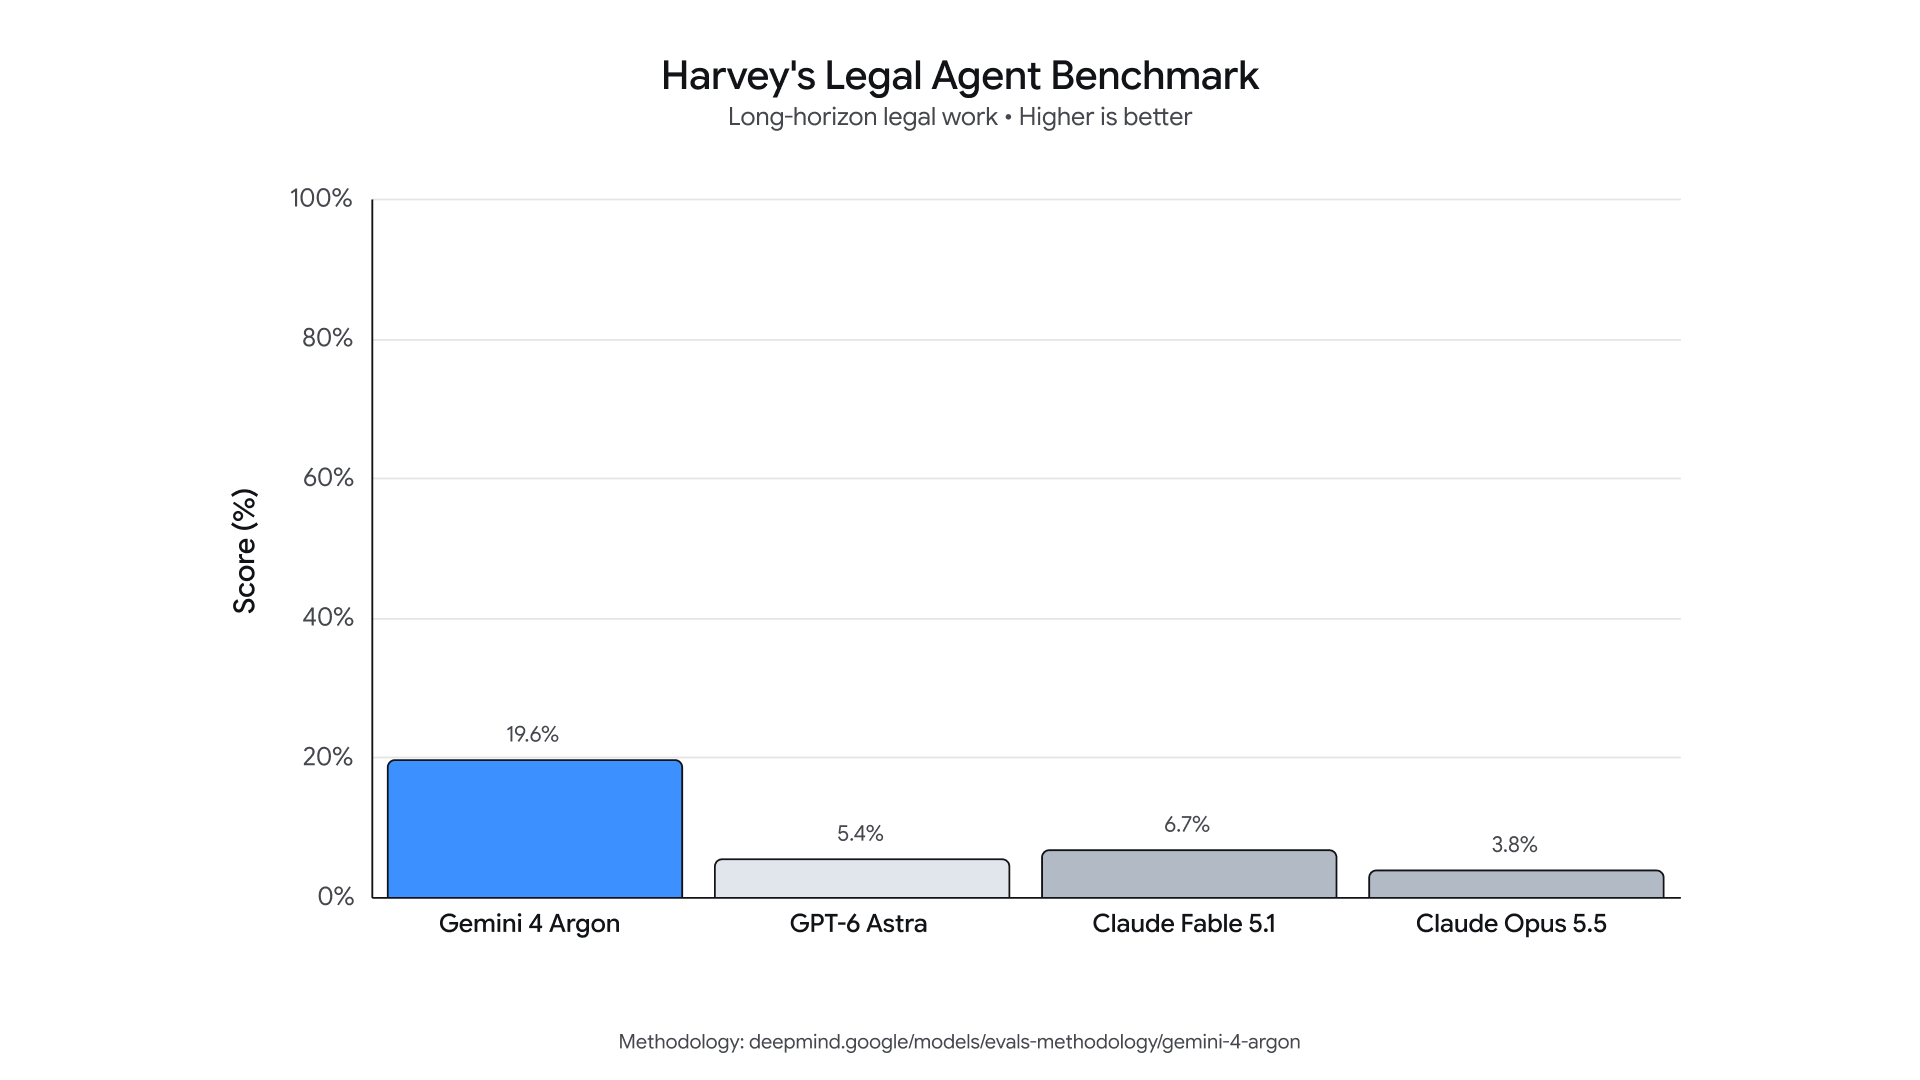
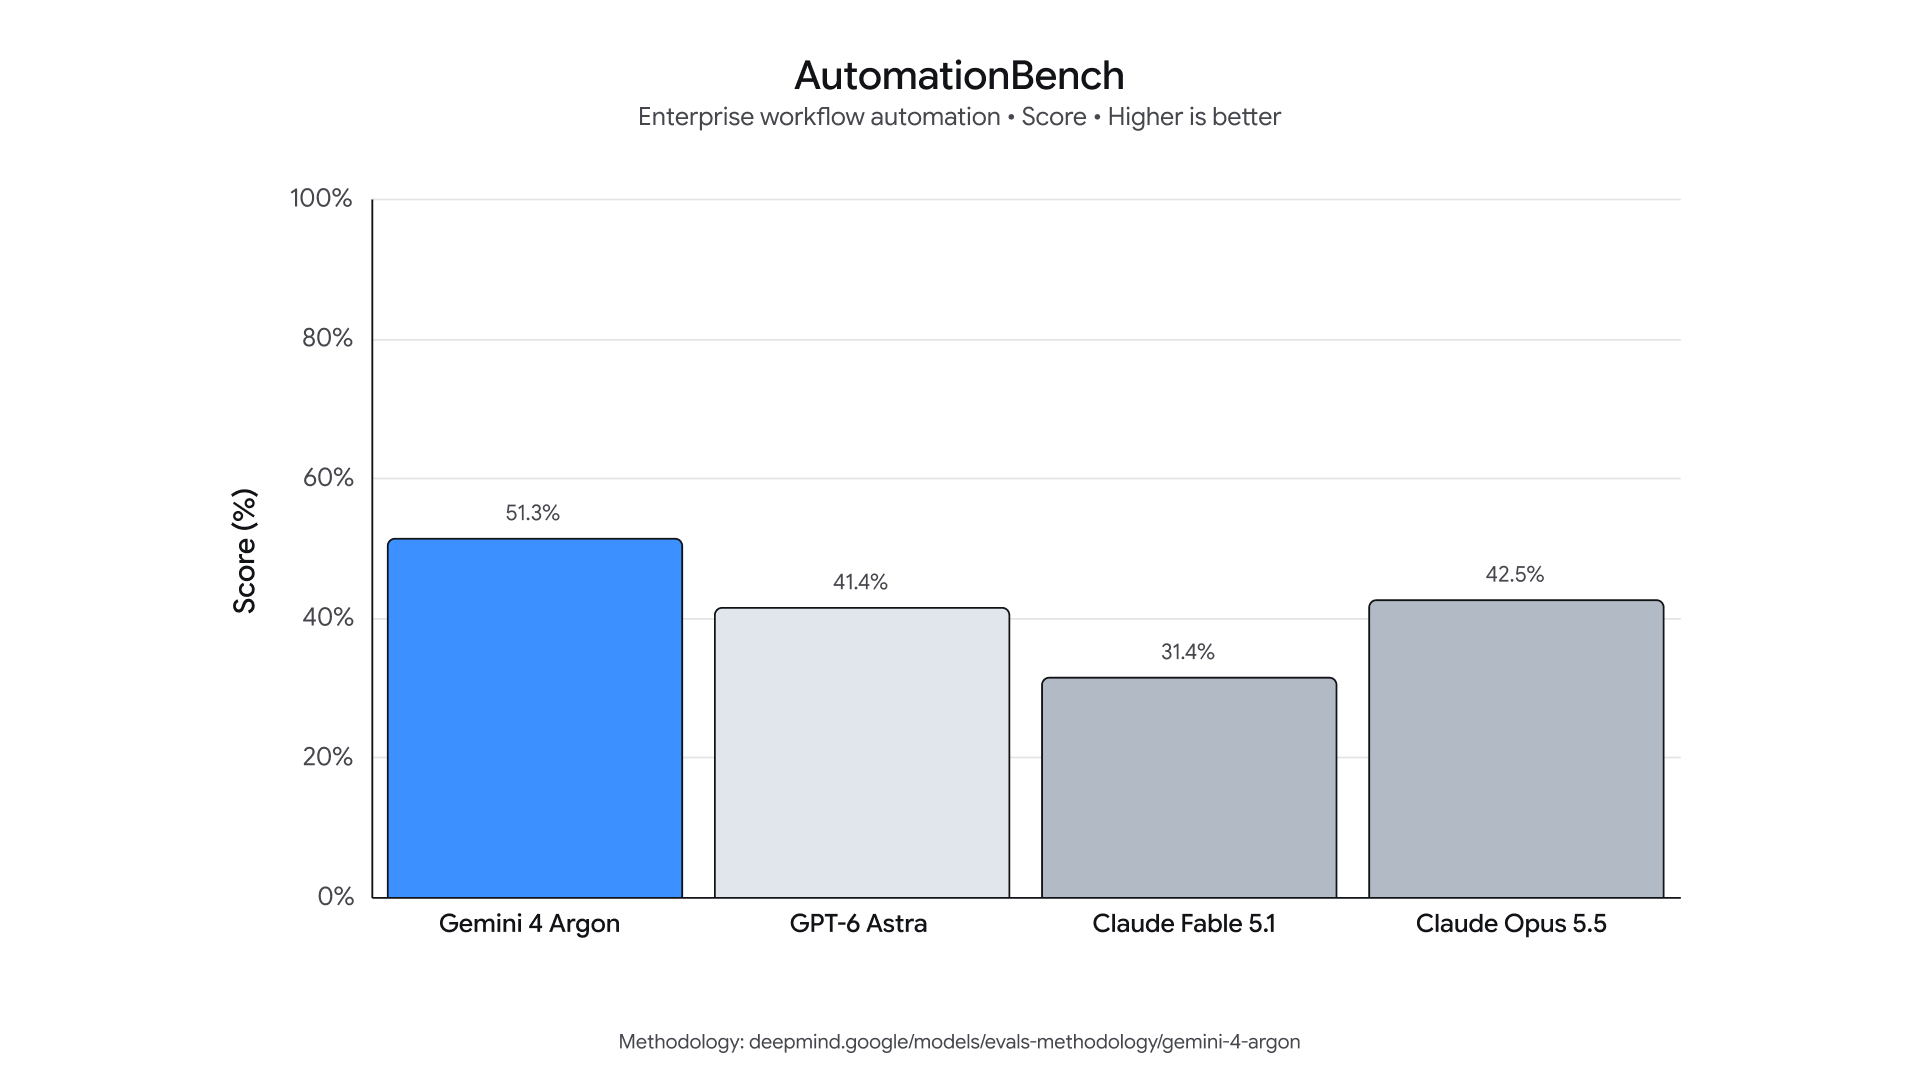
Beyond coding, Argon is the leading model on the Vals Index, which measures economic impact across finance, coding, legal, and tax work, with every sector weighted by its contribution to U.S. GDP. We see similarly leading performance across other domain specific evaluations, like Vals Finance Agent v2 (multi-step financial research) and Harvey’s Legal Agent Benchmark (legal research and drafting). On AutomationBench, Zapier’s benchmark measuring end-to-end execution across core business functions, Argon ranks #1 with a score of 51.3%.

Argon is also uniquely strong when knowledge work requires visual understanding. It’s able to drive professional chart analysis, identify details from long videos, and take action based on a series of documents. For example, on LVBench, which measures long video understanding, Argon is state of the art with a score of 91.7%.

DeepSwe evaluation chart

Vals index chart

Val's finance benchmark chart

Harveys benchmark chart

automation bench chart

Leading in defensive cybersecurity

To better equip cyber defenders for the new era of cyberattacks, we trained Gemini 4 Argon to be highly capable at cybersecurity defense. Argon can autonomously find, validate, and patch critical software vulnerabilities. For trusted defenders and our own internal teams at Google, we’ll be releasing Argon without cyber guardrails so they can leverage its full frontier-level cybersecurity defense capabilities.

Wiz is already using Argon for cybersecurity defense through its Scan for Good initiative – a program dedicated to protecting critical public infrastructure for free by finding and remediating high-risk exposures. In an early demonstration of its impact, the model uncovered a critical vulnerability exposing sensitive personal information across healthcare software used by hospitals worldwide, identifying a severe risk that previous frontier models had missed.

On CWE-bench v1, which evaluates the model’s ability to remediate security vulnerabilities, Argon ties for first place with a top score of 68%, building on 3.8 Flash Cyber’s frontier performance on CWE-bench v0.

CWE benchmark chart

Gemini 4 Argon demonstrates impressive leaps in vulnerability discovery over 3.8 Flash Cyber. For example:

  • On Google’s internal comprehensive vulnerability benchmark, Argon uncovered a wide range of exposures across complex codebases spanning 20 programming languages.
  • On Wiz’s internal black-box penetration testing benchmark, which tests a model’s ability to analyze live web systems without source code, Argon outperforms 3.8 Flash Cyber in discovering the attack surface, identifying vulnerabilities, and producing proof-of-concept evidence to validate them.

security vulnerabilities chart

Strengthening frontier safeguards before broad availability

Before rolling out Gemini 4 Argon broadly, we’re continuing to strengthen critical frontier safeguards across four main areas:

Defending against misuse: To prevent bad actors from using Argon for cyber or chemical, biological, radiological, and nuclear (CBRN) attacks, the model is designed to refuse harmful requests while preserving legitimate, dual-use scientific research, as per our Frontier Safety Framework. We are strengthening the robustness of our safeguards for this launch, including improving our techniques to monitor the model’s internal activations to spot misuse. These safeguards underwent robustness testing by internal and external red teams using a combination of manual and automated attack methods.

Defending against prompt injection attacks: Argon is also our most resilient model yet against indirect prompt injections, where malicious instructions or context are used to hijack a model’s behavior. These are complex attacks that require constant vigilance and multiple layers of defense. Through automated red teaming and adversarial training, Gemini 4 Argon is leading in prompt injection robustness on the Gray Swan’s Indirect Prompt Injection (IPI) benchmark.

Gray Swan evaluation

Monitoring for misalignment: In order to prevent Argon from stepping out of bounds to try to accomplish a task in a way that goes beyond the user’s intentions, we are deploying misalignment mitigations that monitor Argon’s chain-of-thought and actions and stop execution when necessary.

We used a similar system to monitor our training runs and send alerts to a dedicated incident response team, taking careful precautions against feeding the findings back into training so as to not risk shaping Argon’s reasoning to evade our monitoring. We strongly encourage the rest of the industry to preserve reasoning transparency in these pivotal moments of increased capabilities while navigating alignment risks, so that model thoughts remain helpful in identifying and diagnosing misalignment.

Hardening systems: As frontier models grow increasingly capable, safely testing them requires secure environments that can keep up with the systems themselves. In line with our agent control roadmap, we are hardening our sandboxed environments by isolating and sealing them before high-risk training or evaluations begin. We’re committed to sharing these agent security best practices with our partners to improve security across the ecosystem.

Rolling out soon

We built Gemini 4 Argon with frontier-level capabilities on coding, knowledge work, cybersecurity defense, and creative writing to be a partner for developers, professionals, and enterprises while they tackle the most difficult problems. We’re grateful for the initial cohort of cyber defenders and trusted testers whose real-world evaluations and feedback will help us strengthen our systems before we release to developers, enterprises, and consumers, starting with paid API customers and Google AI Ultra subscribers.

1

After the introductory period expires, the price of $4 per 1M input tokens and $20 per 1M output tokens will apply.

The Daily Front Page 3 of 31
Wednesday, September 30, 2026 The Daily Front No. #260930 — Protocols Change Their Minds
article

You said no MCP

by yarapavan·▲ 621 points·350 comments·earendil.com ↗
The world is not static.

Things Change

The first thing to remember is that the world is not static. We have been paying attention to MCP over the last year and the MCP of today is not the MCP of yesteryear. That alone would not be much of a reason to put it into the core, however. As you know, Pi has a great ecosystem of extensions, surely MCP could have been an extension? Maybe even an Earendil endorsed extension. And yes you are indeed correct in that MCP could have been an extension, as it was. That MCP is now part of the core is a result of us putting our heads together and rethinking it.

What Exactly Changed?

The reason we brought MCP into the core is not just about how MCP has changed, but also because we found that the changes it would require were generally useful. For example, the changes we have made to MCP also enable the use of Jev more easily within Pi. Ultimately what Pi needs is quite similar to what MCP needs: a sandbox to play with in the form of an interpreter.

While a lot of things have improved about MCP, quite a few have not. The biggest issue with MCP continues to be that it’s hard to compose. Even with codemode, which is just a neat little sandbox to allow composing of tool calls, MCP doesn’t fully deliver on this. But at that point this is less the problem of MCP but the MCP servers out there and different approaches of harnesses to work with them.

Many MCP servers are still built for harnesses that just dump tools into the context and are trying to optimize on their side for token efficiency by returning text. The way we like to think about MCP at this point is that it should be much closer to OpenAPI with intelligent tool discovery. That means tools should return structured data and tools should be discoverable by their documentation and description.

The reason CLIs are so functional is that the agent and model just wire stuff together with efficient bashisms. But there is no fundamental reason why you can’t do that with MCP either. MCP in Pi is just built on exposing those tools to a JavaScript sandbox like other harnesses like Codex do too.

MCP in a Modern LLM

This will raise the question why we didn’t just do Codemode without MCP. Part of the answer to this has to do with how tools are expressed in Pi today. We did a lot of work in recent months to allow Pi to make sense with new models that allow deferred tool loading, mid-conversation system messages and reasoning level changes. However we did not yet upgrade our tool loadout to better scale to these new capabilities.

In a Codemode world one needs to decide if the tool is available to the LLM or only the codemode part of the LLM. A normal MCP extension does not have enough metadata available from Pi’s tool loadout to make that experience work well. So we needed to ensure that tools can be configured to just be deferred or be a Codemode specific thing.

And while we could have just wired up the metadata to enable better MCP extensions, we also think that MCP with Codemode solves quite a few of the issues that it traditionally had. We believe the best way to positively influence something is to embrace it. And while we think that modern MCP is in a much better spot than MCP ever was, the servers and patterns still leave room for improvement. So we want to be part of that conversation and help shape it to work well in small harnesses instead of standing on the sidelines and just watching.

What Is Codemode?

Now we talked so much about Codemode, it might be worth explaining what that even is. When a harness executes tools, for the most part it has two sides: it can do it where bash runs, or it can do it where the harness agent loop runs. The trust level on both sides is very different. The harness loop quite often runs in an environment that is trusted, whereas the tools it executes often run within a sandbox that is not really all that trusted.

Codemode is special in that it runs where the harness runs. It’s best understood as a mechanism to orchestrate and coordinate tool calls. It’s a sandbox that allows an agent to issue those tool calls in a way that gives it more flexibility about in which order it should do it, and it allows it to use JavaScript to combine them together. Because Codemode also runs on the harness side, its state is also maintained as part of the session transcript instead of the file system.

Now in theory any language could do, but JavaScript is quite attractive as small versions of JavaScript can be shipped as WASM binaries and allow reasonable levels of protection.

In Pi, Codemode is automatically loaded when MCP is configured, or it can be added to the configuration as a default tool. Just ask pi to reconfigure itself to enable codemode! You can then use it for quite interesting things, not just MCP. For instance when you are logged in with a provider that provides “Jev” you can do things like this:

Use typesafe/jev via codemode to find the 20 most frustrated commenters on our issue tracker

And it will cleverly combine things like the Linear MCP and Jev to do that analysis, right from within Pi, without wasting any context at all.

> Use typesafe/jev via codemode to find the most frustrated people on our issue tracker

I'll pull the open issues from Linear and let Jev rate the tone of each thread, four at a time.

codemode
const { issues } = await tools.mcp__linear__list_issues({
  team: "Pi", state: "open", limit: 250,
});
const jev = await models.getModelOfType(
  "classifier", "cloudflare-workers-ai", "typesafe/jev",
);
const questions = {
  frustration: {
    type: "choice",
    instructions: "Judge ONLY the emotional tone of the people writing. " +
      "Ignore how severe the bug is.",
    criteria: {
      none: "Neutral, factual, or friendly, even about a serious bug",
      mild: "Explicit annoyance, impatience, or disappointment",
      high: "Clearly angry, exasperated, sarcastic, or fed up",
    },
  },
};

const results = [];
let next = 0;
async function worker() {
  while (next < issues.length) {
    const issue = issues[next++];
    const { comments } = await tools.mcp__linear__list_comments({
      issueId: issue.identifier,
    });
    const c = await models.classify(jev, { state: { ...issue, comments }, questions });
    results.push({ id: issue.identifier, title: issue.title, ...c.answers.frustration });
  }
}
await Promise.all([worker(), worker(), worker(), worker()]);
store("frustration", results);

const score = (r) => r.probabilities.mild * 0.5 + r.probabilities.high;
const counts = {};
for (const r of results) counts[r.choice] = (counts[r.choice] ?? 0) + 1;
const flagged = results.filter((r) => r.choice !== "none");
flagged.sort((a, b) => score(b) - score(a));
return {
  total: results.length,
  counts,
  flagged: flagged.map((r) => `${r.id} ${r.title}`),
};

... (331 earlier calls)
✓ mcp__linear__list_comments {"issueId":"PI-4714"} 255ms
✓ mcp__linear__list_comments {"issueId":"PI-3200"} 354ms
✓ models.classify cloudflare-workers-ai/typesafe/jev 756ms
✓ models.classify cloudflare-workers-ai/typesafe/jev 750ms

{
  "total": 167,
  "counts": {
    "none": 156,
    "mild": 11
  },
  "flagged": [
    "PI-7740 TUI after /reload does not follows custom tool's re…",
    "PI-9566 context size defaults to 128k despite the real size…",
    "PI-10031 Pi sporadically stuck in \"Working...\" when thinking…",
    "PI-4714 [feature] /update TUI command instead of pi update",
    "PI-5916 Support provider extensions with model aliases and…",
    "PI-7547 [Windows] [sink-thread] How do you use Pi on window…",
    "PI-6907 Add an Installation section to the README",
    "PI-6212 Proposal: Bedrock path should honor `compat.forceAd…",
    "PI-9932 before_agent_start: forced system prompt keeps tool…",
    "PI-7730 High CPU usage on Mac OS with long session",
    "PI-6600 pi update --extensions and npm scripts: npm 11.16.0…"
  ]
}

Most of the tracker is calm. Jev rated 156 of the 167 open issues as neutral, 11
as mildly frustrated and none as highly frustrated.

The clearest cases:

- PI-6907 no installation section in the README (“It's frustrating”) - PI-10031
Pi gets stuck on “Working...” after pressing Esc during thinking - PI-4714 a
/update command request (“a pain in the butt”) - PI-7730 high CPU usage on macOS
in long sessions

The per-issue verdicts are stored in codemode under frustration, so I can dig
into any of them without fetching the issues again.

A condensed replay of such a session in Pi.

We will have more to say about things like Jev and Codemode later, but we hope this post serves as an example of how we continue to adapt and update Pi thoughtfully as the world continues to evolve.

The Daily Front Page 4 of 31
Wednesday, September 30, 2026 The Daily Front No. #260930 — Dispatch From Poland
article

September 2026: The world today, as seen by one Polish guy

by marjancek·▲ 487 points·368 comments·tomwojcik.com ↗
The crises have stopped arriving one at a time.

Scroll to follow one closed strait into fuel pumps, harvests, bond markets and my own country’s winter heating.

I am a Pole. My country borders Europe’s largest war since 1945, heats itself with coal and imported gas, and arms itself on borrowed money. From here the news does not arrive as separate stories.

Every generation believes it is living through the end of something. What is different in 2026 is that the crises have stopped arriving one at a time. A war in the Gulf becomes the price of my diesel, smaller harvests from Sudan to Yemen and a half-empty gas cavern in Bavaria.

The world is not ending. But for thirty years we swapped buffers for dependencies, because a supplier is cheaper than a stockpile and a guarantee is cheaper than an army. When a dependency failed, we did not rebuild the buffer. We found another dependency. Every swap worked for as long as the thing at the other end was there. This year, several of those things were tested together.

One strait, three crises

Start about 4,000 kilometres south-east of Warsaw. US and Israeli military operations against Iran began in late February. Since March, Iran has kept the Strait of Hormuz closed with drones, missiles, mines and small boats.

Tanker traffic through it has fallen by more than 90 percent. The International Energy Agency calls it the largest supply disruption the oil market has ever seen. What follows is that closure travelling in three directions at once: into fuel, into food and into this winter’s heating.

A ceasefire that did not hold

A fragile ceasefire pulled prices back to pre-war levels in early summer, then broke down. By early September Brent crude was near $97 a barrel, up 19 percent in a month, by mid-month it was around $105, and on 24 September it touched $108.

On 22 September Iran handed Washington a written road map: a regional ceasefire of up to 60 days, a phased reopening of the strait and an end to the American naval blockade. Washington rejected it, and by one report the president expects to resume bombing after the November midterm elections.

The detour around the Gulf runs through the Red Sea’s own chokepoint, the Bab al-Mandab, where Houthi forces seized a key Yemeni port this month.

Somebody is getting rich

A chart doing the rounds on investing forums this month shows a tanker-shipping fund going parabolic. It is real. The Breakwave Tanker Shipping ETF, which tracks the cost of hiring a crude tanker, rose more than 600 percent in the first two months of the war and was up more than 2,300 percent for the year by early September. Day rates for some supertankers went from under $100,000 before the war to a record of about $860,000 on 10 September.

The fund is tiny, and its own manager says rates will fall if the strait reopens. But the same closure that empties a granary fills somebody’s brokerage account.

The war next door is burning the same fuel

Ukrainian drones have hit Russian refineries at least 70 times this year, roughly once every four days by the IEA’s count, pushing Russia’s refining output to a two-decade low. Half of its six biggest diesel plants cut or halted output this month, and Moscow has restricted fuel exports.

US diesel passed $6 a gallon for the first time on 10 September. The American president has phoned Kyiv to ask it to stop hitting diesel targets.

France: a run on the pumps

A viral post in mid-September declared that France was running out of fuel. The official data is less dramatic and more instructive. On 20 September, 15 percent of stations had run out of petrol or diesel, up from 11 percent two days earlier. In Grand Est it was 20 percent.

The government rules out a shortage. About nine in ten of the dry stations belong to TotalEnergies, which caps petrol at €1.99 a litre, and drivers fleeing record prices elsewhere emptied its tanks faster than trucks could refill them. The official count also understates the gaps: a station is listed only when it is out of every petrol grade or out of diesel.

A price cap meant as a cushion, in a system with no slack, turned a price shock into empty pumps.

Diesel moves food, and Hormuz moves what grows it

The strait normally carries up to 30 percent of internationally traded fertiliser. The UN Food and Agriculture Organization (FAO) warns that scarcity will cut yields and tighten food supplies through late 2026 and into 2027.

The damage is delayed. Fertiliser that arrives late cannot recover lost yield, and because people keep eating grain planted before the disruption, the system looks fine until the smaller harvests come in.

The baseline was already grim

2025 was the first year in the history of the Global Report on Food Crises with two confirmed famines, in Gaza and Sudan. Funding for food assistance fell an estimated 59 percent between 2022 and 2025.

The World Food Programme estimates that sustained high oil prices could push up to 45 million more people into acute food insecurity.

The harvest at home

Europe’s potato belt tells the story in a single season. Last year there was a glut across the continent; in Poland alone growers lifted about 7 million tonnes, 18 percent more than the year before, and by spring farmers were selling below cost. So growers in Belgium, France, the Netherlands and Germany planted 14 percent less. Then came five heatwaves and a drought. Their growers’ organisation now expects a harvest down 25 percent, one of the smallest in a decade, and in Belgium the price of potatoes for processing went from €10 to €150 a tonne within days.

Grain is dearer too. Milling wheat on the Paris exchange has gone from €191 a tonne in January to about €245, a rise of 28 percent, and maize is up 36 percent. At Polish purchase points wheat has gone from 778 zloty a tonne to about 900, and maize from 748 to over 930. Back in May, traders were already pointing to frost and drought here, drought in France and America, and record energy prices.

Self-sufficient, and paying anyway

By Credit Agricole Bank Polska’s count, on FAO data, we are the most food self-sufficient country in the EU, covering our own needs in seven of nine food groups, everything except fish and vegetable fats. In a normal year we grow about a fifth more grain than we use, and we are among the world’s ten largest food exporters. If any country should be insulated from a food shock, it is this one.

It is not, because self-sufficiency is counted in tonnes and prices are set elsewhere. Polish grain buyers follow the Paris exchange with a lag of three to seven days. When the world pays more, our grain can simply leave, so the price at home has to match. And the harvest itself is made of things we do not control: diesel at a record, fertiliser that has to sail through Hormuz, and water that the Vistula no longer carries. Poland can feed itself. It cannot price itself.

We traded one dependency for another

After 2022 we Europeans replaced Russian pipeline gas with liquefied natural gas (LNG) bought on a global market, and Qatar, shipping close to a fifth of the world’s LNG through Hormuz, was one of that market’s pillars. QatarEnergy declared force majeure in March. Drone damage at Ras Laffan has taken about 17 percent of capacity offline, with repairs estimated at three to five years.

In August roughly one Qatari cargo made it through the strait, against a pre-war flow of some 6.5 million tonnes a month, dozens of cargoes.

Gas storage is at a record low for the date

The summer heat that drove up cooling demand also forced nuclear plants to curtail output, and wind generation was weak. The new dependency ran through a chokepoint about 39 kilometres wide at its narrowest.

Poland made the same swap, with oil

After 2022 we stopped buying Russian crude, and Saudi Aramco became the main supplier to Orlen, Poland’s state-controlled oil refiner, at about 40 percent. That oil reached us without passing Hormuz, through a 1,200-kilometre pipeline across the Arabian desert to the Red Sea. On 10 September drones shut that pipeline. Aramco cancelled late-September cargoes and has reportedly told its European buyers to expect none in October. The pipeline restarted on 22 September at a trickle, with no date for full flow.

Orlen is buying on the spot market from Norway, Britain, Algeria, Kazakhstan, Azerbaijan and the Americas, and a new deal with Equinor covers up to a quarter of its refining capacity. Orlen says its refineries are being supplied without disruption. But an energy journalist, Jakub Wiech, writes that a pump price starting with a nine, 9 zloty a litre, is no longer out of reach.

We have been burned on the spot market before

Orlen set up a Swiss trading arm in 2022 to find oil that was not Russian, and gave it $600 million to work with. In November 2023, during a brief easing of US sanctions, that unit agreed to buy six million barrels of cheap Venezuelan crude. Within days it wired a $230 million advance to a Dubai intermediary, with no collateral and no bank guarantee. According to a Financial Times investigation, most of the money was turned into Tether, a crypto token pegged to the dollar, and handed over on USB sticks to brokers in Caracas hotels and restaurants.

One cargo worth about $29 million arrived. Chartered tankers waited off Venezuela for months, at a cost of some $72 million. The state now puts the total loss at about 1.6 billion zloty, or $424 million. In August, Warsaw prosecutors charged three former managers, who deny wrongdoing and face up to 25 years in prison.

It is worth remembering now, with the company shopping in a hurry again. A country that loses its regular supplier does not only pay more. It ends up dealing with people it does not know.

The old buffer, coal, is running thin

Then there is heat. Stockpiles at our mines are down roughly 43 percent in a year, and the country’s biggest miner expects its own heaps to shrink to practically nothing by December.

In mid-September the head of Orlen Termika told an industry conference that a frosty winter would mean running out of coal, with everyone “scraping along the bottom.” He was dismissed the next day, though the company did not give that as the official reason.

The household fallback is gone by law

Since September 2019 Kraków has banned coal and wood in boilers, stoves and even fireplaces. Residents are left with gas, heating oil, electricity or district heat.

The ban was a serious answer to a serious problem, in a city notorious for its winter smog. But it shows the same pattern as everything else here: a sound policy that removed a redundancy on the assumption that the replacement fuel would always be there.

A strong El Niño points to a milder winter. How hard this winter is now depends on the weather.

The bill comes due

Now go about 8,600 kilometres east of Warsaw. For years the Bank of Japan held interest rates at zero, so Japan’s savings went abroad. Pension funds and insurers poured trillions into foreign bonds, and Japan became the largest foreign owner of US government debt, with about $1.2 trillion of Treasuries. It was the world’s most reliable lender, and it helped keep borrowing cheap for everyone, America above all.

The patient lender is going home

That era is ending. On 18 September the Bank of Japan raised its policy rate to 1.25 percent, the highest since 1995, and a former board member expects a rise roughly every three months, towards 2 percent by the middle of 2027. Japan’s 10-year yield crossed 3 percent and reached 3.1 percent on 25 September, the highest since August 1996, pulled up by oil in the inflation numbers, by the Bank’s own hikes and by American yields. Japanese investors sold $29.6 billion of US debt in the first quarter alone.

Strategists do not describe a stampede home. They describe Japan quietly ceasing to be the buyer everyone could count on, and long-term borrowing costs rising everywhere as a result.

America: the borrower at the other end

The US 10-year yield reached 5.2 percent on 25 September, the highest in nineteen years, since the summer before the 2007 crash. On 16 September the Fed raised rates for the first time since 2023, and markets price another rise. The drivers are the ones this essay is about: oil showing up in inflation expectations, a deficit that keeps growing, and weak demand at a Treasury auction, which is what happens when the patient buyer stays home. A 30-year mortgage now costs 7.12 percent, up from 6.09 in February.

Buyers are pausing and builder confidence is at a 12-month low. This is how a bond sell-off reaches a household: through the monthly payment.

Does America’s housing weather reach Poland?

My instinct says that whatever happens to American mortgages arrives here a little later. The research half agrees. House prices across rich countries move together, more so with each decade, and the IMF’s explanation is financial conditions that mirror America’s. After the American bust of 2006 it took about two years to reach us. In 2021 our central bank raised rates five months before the Fed, and both markets froze in the same year.

This time I do not need the research, because I have spent the past year looking for a house. The headline says Polish banks lent a record 14.8 billion zloty for housing in July. Look underneath it. The average loan is at a record because prices are, and more than a fifth of new lending is people refinancing old loans. Meanwhile developers in the seven biggest cities sit on a record 70,000 unsold flats, nearly 30 percent of them stale stock. Sales fell by about a tenth in the second quarter, though they were still above a year earlier, new supply is shrinking, selling takes longer and prices have stopped rising without coming down. Analysts disagree on why: some point to dearer credit, others to fear, with four in ten consumers expecting unemployment to rise. It looks like the American picture, for partly different reasons. Volume freezes, prices stay put and sellers wait.

And the Polish loan is the worse product. An American locks in a rate for thirty years. Here the regulator’s minimum is five, which is what most banks offer, and a single bank, BNP Paribas, goes to ten. Its own example this month shows a five-year fix at 5.95 percent, about a point below America’s 6.97, for one sixth of the certainty. After five years the rate floats, and the risk is mine.

Meanwhile, shares are at records

The S&P 500 set an all-time high in August. Seven technology companies make up about a third of the index, the same concentration as at the peak of the dot-com bubble, and JPMorgan’s chief technical strategist says the pattern in AI shares resembles the months before that bubble burst.

The bulls have an answer. Nvidia trades at about 45 times last year’s earnings, where Cisco traded at 472 times in 2000, and today’s leaders are hugely profitable.

Whether it is a bubble I cannot tell you. What I can see is a stock market priced for perfection sitting on top of a bond market that is repricing everything, and anyone with a pension owns both.

Europe pays more too

The same repricing is running through my own continent. Germany’s 10-year yield reached 3.57 percent in mid-September, the highest since 2009. France pays about 4.5 percent, the most since 2008, and has lately paid more than Italy as its debt heads for 118 percent of GDP before the 2027 presidential election. Britain’s 10-year gilt touched 5.29 percent, the highest since 2007.

The ECB has raised rates twice this year, with energy prices in the eurozone up 14 percent on a year ago. Each chip on the chart is what a government paid to borrow for ten years in mid-September.

Why a Pole watches Tokyo

Our own 10-year yield went above 6.4 percent this month, the highest in about three and a half years. It was 4.88 percent in February, before the war. Servicing the national debt will cost 90 billion zloty this year, 19 percent more than last, and Poland has raised defence spending faster than any other NATO member.

A state that must arm itself, heat its cities and look after an ageing population needs patient lenders. The largest pool of patient savings in the world is drifting home at exactly the moment everyone needs to borrow.

The buffer we are missing at home

The draft 2027 budget keeps the overall public deficit at 7.1 percent of GDP, and the state budget alone is a record 282.6 billion zloty in the red, with defence at 4.5 percent of GDP. Public debt passed the EU’s 60 percent ceiling for the first time early this year. Fitch and Moody’s have both moved Poland’s outlook to negative, and both point to the stand-off between the government and President Nawrocki, who has issued more vetoes than any president before him.

The sharpest was over €44 billion in EU defence loans. The president says they would indebt Poles for decades and threaten our sovereignty. The prime minister says blocking them weakens our defences. Whoever is right, lenders see a state that cannot agree on how to pay for a war it fears, with an election due in autumn 2027.

This is what the 6.4 percent is. A country on NATO’s front line pays it for a reason. Some of that premium is the front line, and some is a 7 percent deficit and a world that has repriced all debt. Either way, the number is what lenders think of us, and nobody wants to find out what those bonds are worth on the day Article 5 is invoked. The counter-argument is that the yield is the payment for exactly this risk, and every “safe” currency in this chapter has a debt problem of its own.

The security umbrella folds

Russia’s invasion of Ukraine is in its fifth year. Poland joined NATO in 1999 on the premise that the American guarantee would never be in question. The Pentagon is now weighing a withdrawal of 25,000 to 40,000 of the roughly 80,000 US troops in Europe, with a final recommendation due on 6 November and no decision yet made.

Congress has written speed bumps into law, requiring certification and consultation before troop levels drop below 76,000. The 5,000 already leaving Germany would by themselves take the force below that line. On 17 September Donald Trump announced “major progress” towards a permanent US Army base in Poland. In May the same administration halted a 4,000-strong rotation here without warning. I will believe in the base when I can see its fence. Deterrence rests on belief, and mine is not what it was.

Two kilometres from my country

On Sunday 13 September a Russian jet-powered drone destroyed a locomotive at Yahodyn station, two kilometres from the Polish border. A diplomatic train carrying the former British prime minister Boris Johnson, Britain’s national security adviser and other European officials home from a conference in Kyiv had crossed into Poland about half an hour earlier, running ahead of schedule because of the threat of strikes. The train that was hit had been evacuated fifteen minutes before, and nobody was hurt.

Russia says it struck railway infrastructure. Ukraine’s railway says the diplomatic train could have been the target. Donald Tusk called an emergency meeting and said Russian actions were “getting closer and closer to our border.” Four days later he gave the speech on the next card.

A warning from my own prime minister

On 17 September, the 87th anniversary of the Soviet invasion of 1939, Donald Tusk told the Polish parliament that Russia intends to send drones or missiles into the territory of Ukraine’s allies this autumn and winter, and then call the strikes accidental. He cited intelligence from NATO allies, Ukraine and Poland’s own services.

The aim, he said, is to paralyse NATO, or at least to show that Article 5 exists only in theory. He stressed that nothing suggests an invasion. Germany has meanwhile blamed Russia for a drone attack in August on Leipzig airport, a NATO logistics hub. Moscow denies it.

The week after the speech looked like the thing he described. On 23 September a Russian military helicopter crossed briefly into Polish airspace from Kaliningrad, north of Braniewo. The same day a fire broke out at a Starlink ground station near Warsaw that connects Ukraine, among others, to the satellite network. The digital affairs minister called it arson in a “clearly Russian” style, then conceded he could not say for certain. Two days later the interior ministry published instructions for an air attack and said the country’s 85,000 shelter points, with room for 64 percent of the population, will be signposted by the end of the year. The foreign minister’s words were that Russia is planning something big this year.

Read this next to the last two cards. The test Tusk describes is a test of belief, and it arrives just as the Pentagon decides how many Americans stay.

Peace talks, again

US-led talks resumed in early September after a six-month pause, with Donald Trump’s envoys carrying a proposal whose contents nobody outside has seen. In July, people close to the Kremlin said Vladimir Putin has no plans to resume talks with Ukraine until his forces take the rest of the Donbas.

For Poland the outcome decides what kind of neighbour we get. It also decides the future of almost a million Ukrainian refugees who are still here. Their special status ended in March, most of them work, and they fill jobs that a shrinking country cannot.

The underwriter walks away

The American guarantee was never only military. The same country underwrote the world’s aid budget and the public-health institutions much of the world copied. In 2025 it began to withdraw from all three.

USAID supplied more than 40 percent of global humanitarian funding until January 2025. Then Washington gutted it, other donors followed, and global health aid fell by nearly 27 percent in a year. Deaths of children under five rose in 2025 for the first time this century, from 4.6 to an estimated 4.8 million. Modelling in The Lancet Global Health projects how many additional deaths follow by 2030 as the US and other donors cut aid.

The retreat from expertise shows inside America too. Measles was declared eliminated in the US in 2000. The country logged 2,288 cases in 2025 and has already passed that this year, with about 3,500 by mid-September across 47 jurisdictions, and is judged highly likely to lose its elimination status in November.

The lazy word for this is “idiocracy.” I have used it myself, and it is wrong. Measles did not come back because people got stupid. It came back because vaccination had been slipping for years, and the government that should have pushed back began arguing with its own experts instead.

Little of this touches Poland directly. It matters here because it shows what kind of guarantor we have. The troop review, the aid cuts and the vaccine politics are one government changing its mind, and a country that built its safety on a single American promise should notice how quickly the other promises were withdrawn.

Everything so far happened in the last year and a half. Underneath it, three slower clocks are running, and they set the terms on which we meet the next shock.

The climate is changing what our land and rivers can carry. The technology that is making a few companies very rich is letting them hire fewer of us at the bottom. And my country is running out of people. None of these will be settled by a ceasefire, and each of them takes away a buffer we used to take for granted, or adds a dependency we have not yet paid for.

The physical world isn’t waiting

August 2026 was the warmest August on record and tied July 2023 as the hottest month ever measured.

The developing El Niño has already broken the record for strength and is still growing, and scientists say 2027 will almost certainly be the hottest year on record. On 22 August the average surface temperature of the world’s oceans reached 21.1°C, edging past the record set during the last El Niño in 2024. At home, in June, Poland used about 7 percent more electricity than a year earlier, mostly because air conditioners ran through a record heatwave, and in the same summer the country set a new national heat record of 40.5°C, beating a mark that had stood since 1921.

On water, a UN University report published in January argues that more and more river basins and aquifers can no longer return to their historical normal. Its point is that the word “crisis” implies a temporary emergency followed by recovery, and in many places that no longer describes reality. The report’s term is “water bankruptcy.”

The abstraction ends at the Vistula. In Warsaw the river fell to 94 centimetres this month, the lowest since standardised measurements began in the 1950s, after records of 102 and 100 in August, 98 early this month and 104 last September. The bottom of the normal range at that gauge is 180. The weather institute has 90 hydrological drought warnings in force across the country. At Annopol the level is the lowest in more than 70 years. In Warsaw the city ferries have not sailed since late July, and 56 percent of Poles say they notice the effects. Low water also took about 2,000 megawatts of coal-fired power offline in August, because the plants at Kozienice and Połaniec are cooled by the river, and the grid operator invoked emergency measures three times over the summer, against twice in the previous eight years.

Poland is not without buffers here. It has about a hundred reservoirs big enough to count, half of them built before the war, for a climate in which rain came steadily. Less of it falls now, and what falls comes in bursts that a reservoir on one river cannot catch. One Warsaw paper wrote that the river is scraping along the bottom, the same words the sacked heating boss used about our coal.

An economy that needs fewer of us

The IT eldorado is over, and the people who built their lives on it are finding out what it rested on. The official statistics are slow to show it. The people living through it are not.

About 120,000 tech jobs were cut worldwide in the first half of this year, and the first quarter alone saw more than twice as many as a year earlier. May was the worst month for US tech job cuts in almost two years. Amazon has shed 30,000 corporate roles in two rounds, Meta a tenth of its staff, Block nearly half. These are companies reporting record revenue, and Amazon’s chief executive has said in plain words that AI agents mean the firm will need fewer people for some of the jobs done today. Some analysts think AI is partly the excuse, and that the savings pay for data centres. For the person laid off, the difference is academic.

In Poland the party ended in 2023, when IT job postings fell by a third in a year. The market that has come back since is a different one. Postings are up sharply in 2026, but more than 90 percent of them are for mid-level and senior people. Juniors get about 5 percent, and an entry-level listing draws 47 applications on average, 146 for a junior frontend role. In Kraków, where nearly half of all corporate jobs are in business services, group layoffs have run into the thousands two years in a row. HSBC is cutting about 400 jobs there and moving the work to India, and Shell has let 300 people go.

I have to be honest about what the headline numbers say, because they say something different. Kraków’s unemployment rate was 2.8 percent in August, up from about 2 percent at the end of 2024. In America recent graduates faced 5.6 percent unemployment against 4.2 percent overall, a Stanford study puts employment of workers aged 22 to 25 in the most AI-exposed occupations about 19 percent below where it would otherwise be, and economists still argue about whether AI is the cause. Mass white-collar unemployment is not in the data. What is in the data is a ladder with its bottom rungs sawn off, and a middle class that has stopped feeling safe.

Remote work is where it bites hardest. Those who have a remote job mostly still have it, but new ones have dried up. Postings offering remote or hybrid work peaked at more than 10 percent of American job ads in 2022, and today only about 4 percent of new postings are fully remote, each drawing more than two and a half times the applications of an office job. On one of Poland’s biggest IT job boards, hybrid overtook remote this year for the first time in years.

So picture the engineer who spent the good years building a house two hours from any city, on a salary the local economy could never pay. While the job lasts, nothing has changed. On the day it ends there is nothing within driving distance, and the remote market that once competed for them now draws a crowd for every opening. They were rich, and on paper they still are.

And driving distance has shrunk. Petrol in Poland rose by more than a zloty a litre in the first days of September, when the reduced VAT on fuel expired just as Hormuz tightened again, and diesel reached a record 8.89 zloty in mid-September and has since passed 9 in some regions. Take the classic commute between Katowice and Kraków, about 160 kilometres a day. At today’s prices that is roughly 90 zloty of petrol for every day at the office, close to 1,900 zloty a month, and some 330 zloty more than in August. The job in the next city, which used to be the fallback, pays less every time the price board changes.

It is the same swap at household scale. A buffer, the job market within driving distance, traded for a dependency on one kind of employer staying generous. In 2021 it was the rational choice. So, a year later, was Qatari gas.

Growing old

Underneath all of this, my country is quietly disappearing.

Poland’s fertility rate fell to 1.07 in 2025, a record low and barely half the level of 1990. It is lower than Japan’s. About 238,000 babies were born last year, the fewest since the Second World War, and 406,000 people died. The population has fallen almost every year since 2012 and stood at about 37.2 million at the end of June. If birth rates stay where they are, the statistics office’s own simulation puts it at 29.4 million by 2060, and Eurostat’s forecast for 2100 is 25.6 million. Nearly a quarter of Poles are already of retirement age, against one in eight in 1990.

We are not an outlier, and we are not the extreme: South Korea was at 0.8 last year. A demographer who sits on the Polish president’s family council points out that practically all of Europe has seen fertility drop sharply in the last three or four years. Higher child benefit and renewed IVF funding have not halted the slide, and the social insurance institution calls it unrealistic to expect migration to fill the gap.

So who will do the work, and who will look after us? Migration, later retirement and more people in work can each cover part of the gap. For the rest, the answer on offer is machines. More than half of all the factory robots installed in the world in 2024, 54 percent, went into Chinese plants. China’s working stock of about two million robots is four and a half times Japan’s, and Chinese suppliers’ share of their own home market rose from 30 to 57 percent in four years. Beijing’s new five-year plan puts AI-powered robots at the centre of its industrial strategy, and by one industry estimate Chinese firms already account for close to 90 percent of the humanoid robots shipped worldwide. The frontier AI such machines will need is, for now, mostly American, though Beijing plans to change that.

The robotics federation itself cautions that humanoids in real production are still demonstrators and pilot projects, so this is a hope and not a plan. But follow it through. A continent that swapped Russian gas for Qatari LNG would be replacing its missing workers with machines made in China, running software written in China or America. For a country like mine that is a third dependency, on top of energy and defence, and it arrives just as the money to pay for it gets more expensive.

The common thread

What I see from Poland is not a dozen separate crises. It is one design flaw, viewed from a place with less slack than most: for thirty years we swapped buffers for dependencies, and called the saving efficiency.

Supply chains ran just in time. One strait carried about a fifth of the world’s traded oil and gas, and when Europe lost its Russian gas it bought replacement gas from the same strait. One country’s savers kept everyone’s borrowing cheap. One ally guaranteed a continent’s defence, funded more than 40 percent of the world’s humanitarian aid and set the standard for what counted as expertise. A generation of engineers built their lives on one kind of employer.

The slower clocks work the same way. Our reservoirs were built for a wetter, steadier climate, so a dry summer now takes power stations offline. We are not having the workers we will need, so the best hope on offer is to buy robots from China. Each is a buffer we used to have, or a dependency we are about to take on.

None of it is irreversible, and not everything is getting worse. Europe burns 10 to 15 percent less gas than in 2021, partly thanks to renewables, and the American death rate fell to a record low last year. But a system without buffers gets through one shock at a time, and this year several arrived at once.

What I am preparing for

I cannot forecast any of this. What I can do is decide what I would regret not having done.

Two official statements frame everything below. The European Commission says there is no immediate security-of-supply concern for the winter of 2026–27. And the Polish government stresses that its household Safety Guide is voluntary and does not signal a rising threat. I believe both. I also notice that the guide exists, and that it asks every household to be able to cope alone for 72 hours.

So I prepare for the boring version of each crisis, because that is the likely one: hours without power, not months; queues and prices, not collapse. I also prepare for the version in which the strait reopens and everything looks fine, because that has happened once already this year. The early-summer ceasefire pulled oil back to pre-war prices within weeks, before it collapsed. A Qatari plant that needs three to five years of repairs does not care about the next ceasefire, and fertiliser that was not spread this season cannot be spread in retrospect. Relief is not repair. The buffers would be exactly as thin as before.

Fuel first, because that is where this year has already reached me. I cut the kilometres I must drive and the energy my home needs before I cut anything else. I fix the rate on what I owe for as long as a bank will let me, which here means five years, and I keep more cash than feels clever. I expect price caps and rationing, and I expect them to create queues, because that is what a price cap did in France.

Heat and power next. Before winter I want to know how my own heating behaves in a power cut, because a gas boiler, a pellet stove and a district-heating substation all need electricity to run. Ukraine has lived the schedule of two hours with power and eight without, and in tower blocks that meant no heating, no water pressure and no lifts, while houses with a gas supply coped far better. Ecuador reached 14 hours a day without power in 2024 with no war at all, because of drought. So I hold water and food that needs no cooking, a radio, torches and a battery I can recharge in the hours when power is on, and I have found out where my municipality would open a warm, powered room. People also die from running generators indoors.

Water, which surprised me. Our big coal plants are cooled with river water, and in 2015 a heatwave ended with power rationed for 1,600 of the country’s largest companies. So I treat water as something that can run out: a rain barrel, a garden that needs less, a look at where my town’s supply comes from. From 2027 our power plants will be allowed to cool with treated sewage water. That is what adaptation looks like: unglamorous, late and better than nothing.

And the test my prime minister warned about. Not tanks; he has said plainly that nothing suggests an invasion. It looks like September 2025, when Russian drones crossed into Poland, airports closed for hours and a NATO member fired shots for the first time in this war. So I know where the nearest shelter is, which is about to get easier once the shelter points are signposted, I keep documents and some cash at hand, and I have agreed a meeting place with my family, as the Safety Guide asks. Beyond that I would try hardest not to panic, because panic is the product being sold.

Read that list again and it is the same one every time: water, cash, a fixed rate, fewer kilometres, a way to stay warm without the grid. They are buffers, the small household kind. I cannot rebuild the national ones. I can rebuild mine, and I would rather do it in a boring year.

The Daily Front Page 5 of 31
Wednesday, September 30, 2026 The Daily Front No. #260930 — The Awkward AI Race
article

The AI Race Just Got Awkward

by allisdust·▲ 380 points·417 comments·insufferable.dev ↗
The Chinese labs have thrown a lifeline to the Western loss-making labs.

If you read the news headlines these days, you would be forgiven for thinking that the Western labs are getting spawn-camped by Chinese labs en masse.

The Distillation Drama

Not a week goes by when Anthropic doesn’t release another article on how the Chinese are distilling their models, becoming a danger to humanity itself, etc.

It’s beneficial for them to say that because it sets the ground for these models to be restrained legally and regulatorily later on.

But it’s clear that the days of mindless distilling are over.

Not just over. The new game in town is adopting Chinese labs’ advances. Note how I call this adoption instead of the more vitriol-infused “stealing” that Anthropic tends to use.

That’s because, unlike the Western companies, the Chinese are pretty much giving away their recipes.

A Different Game

The latest one shamelessly copied without acknowledgement is the breakthrough in KV cache optimizations that DeepSeek has generously shared with the world.

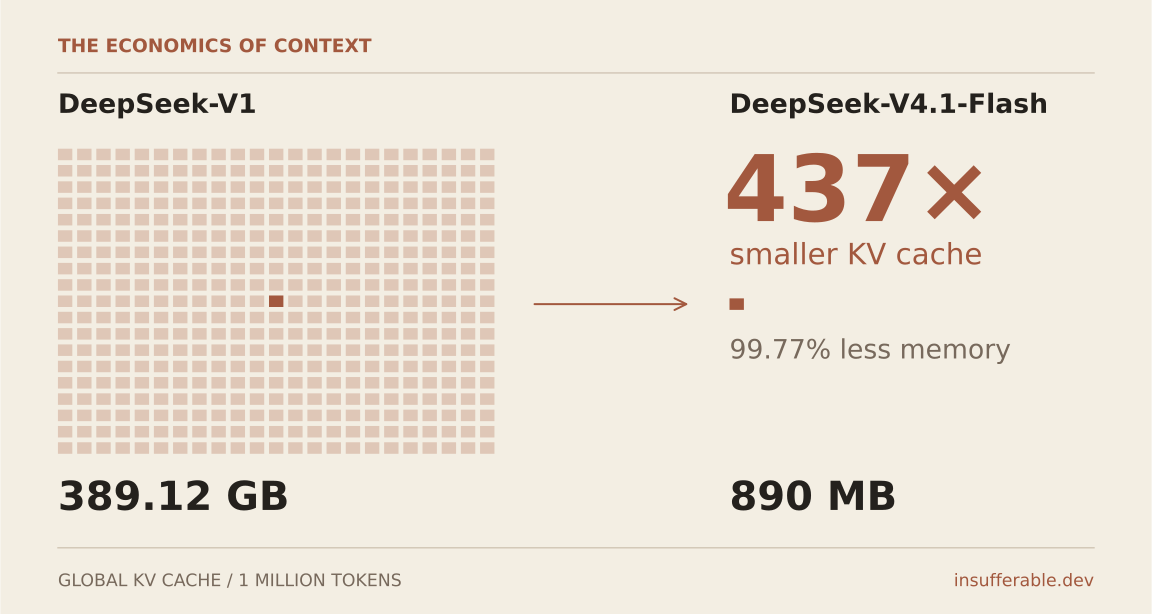
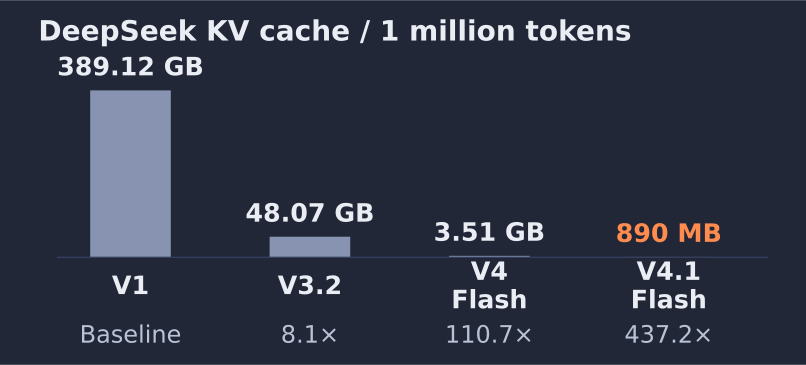
It is a mind-blowing optimization that basically dropped the KV cache footprint for certain use cases that use a long session context, like coding, by a factor of roughly 437x compared with DeepSeek-V1.

They were the first ones to release the MLA architecture, which compressed the cache by roughly 15x, and then followed it up with ‘Compressed Sparse Attention’ and ‘Heavily Compressed Attention.’ The latest DeepSeek-V4.1-Flash pushes it even further with CSA2, cross-layer cache reuse, a causal encoder-decoder architecture, and FP4 caching, bringing the global KV cache down to 890 bytes per token.

Why do these things matter? Because for serving long-context models, one of the largest costs is the VRAM needed to hold this cache in GPU memory.

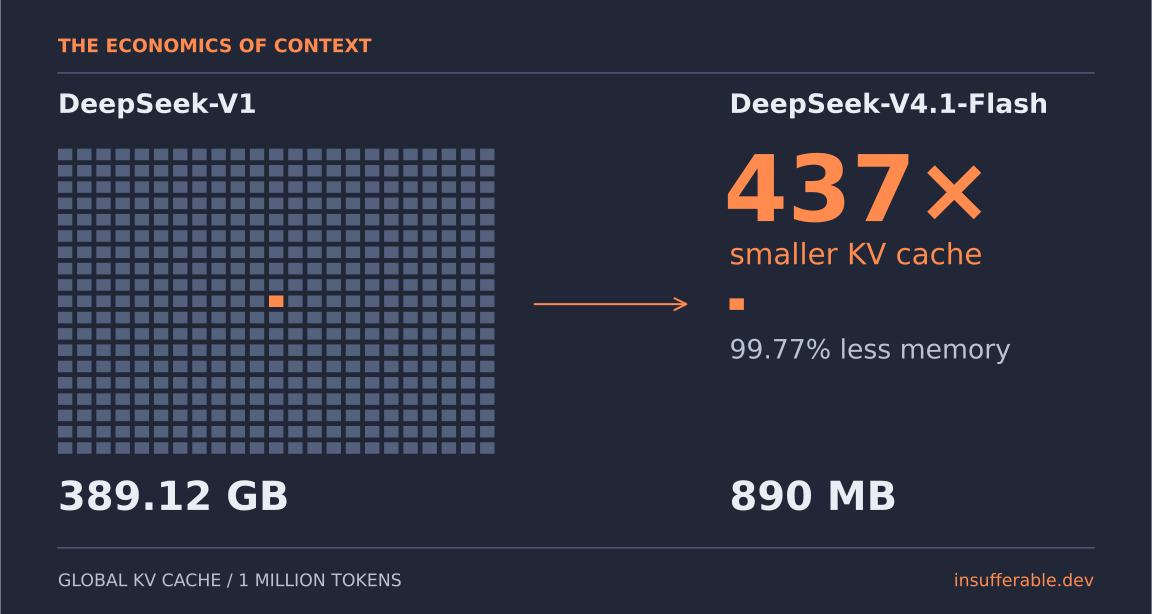
437 equal-area squares shrink to one: 389.12 GB of KV cache becomes 890 MB per million tokens. Approximately 99.77% less memory. 437 equal-area squares shrink to one: 389.12 GB of KV cache becomes 890 MB per million tokens. Approximately 99.77% less memory.

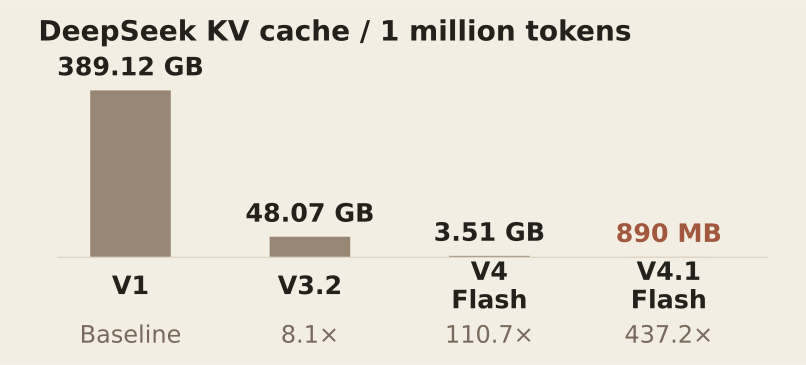
Below is the graph showing just how crazy this whole thing is:

KV cache memory per million tokens: DeepSeek-V1, 389.12 GB; V3.2, 48.07 GB; V4-Flash, 3.51 GB; V4.1-Flash, 890 MB. The latest cache is 437.2 times smaller than V1. KV cache memory per million tokens: DeepSeek-V1, 389.12 GB; V3.2, 48.07 GB; V4-Flash, 3.51 GB; V4.1-Flash, 890 MB. The latest cache is 437.2 times smaller than V1.

Follow the Cache Money

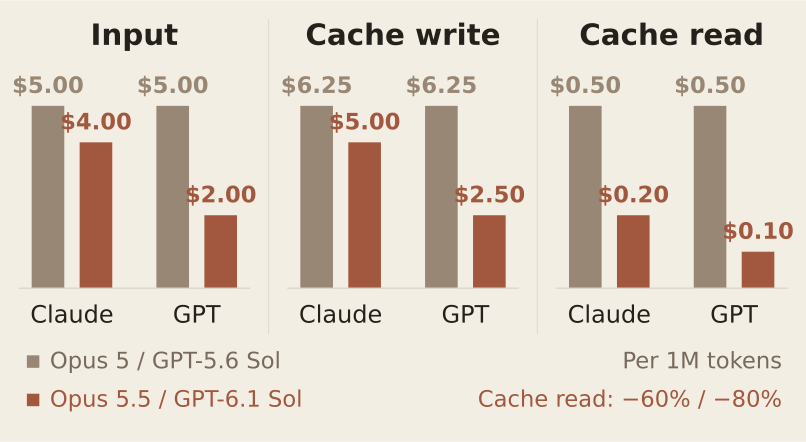
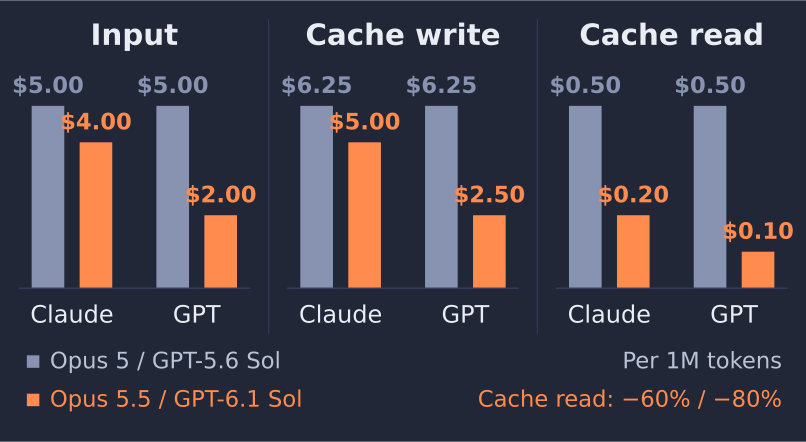
Compare that with what the same tier cost roughly two months ago. All prices below are per 1 million tokens:

Pricing per million tokens, before and after. Anthropic Opus 5 to 5.5: input $5 to $4, cache write $6.25 to $5, cache read $0.50 to $0.20, 60% cheaper. OpenAI GPT-5.6 Sol to GPT-6.1 Sol: input $5 to $2, cache write $6.25 to $2.50, cached input $0.50 to $0.10, 80% cheaper. Pricing per million tokens, before and after. Anthropic Opus 5 to 5.5: input $5 to $4, cache write $6.25 to $5, cache read $0.50 to $0.20, 60% cheaper. OpenAI GPT-5.6 Sol to GPT-6.1 Sol: input $5 to $2, cache write $6.25 to $2.50, cached input $0.50 to $0.10, 80% cheaper.

A Very Quiet Thank-You

All this must mean the Western AI companies are now extremely inference-margin positive.

The constraints on access to advanced GPUs forced Chinese labs to make performance optimization a number one goal, and it shows in the results.

Now I don’t know why they would freely give away such a breakthrough, but they just did, and for once both Anthropic and OpenAI released models that are basically top-tier and are using these optimizations.

They do seem to be a little embarrassed by the copying. Hence the silent releases without much pre-announcement for both Claude Opus 5.5 and GPT-6.1 Sol.

The user reviews have been stellar w.r.t. usage, and the quality doesn’t seem to be that far off compared to their flagship models (Claude Fable 5.1 and GPT-6 Astra).

The cache read costs are the proof of the adoption. They dropped sharply: Opus 5.5 cut cache-read pricing by 60% versus Opus 5, while GPT-6.1 Sol cut it by 80% versus GPT-5.6 Sol’s late-July pricing.

So the Chinese labs have thrown a lifeline to the Western loss-making labs, and I just have no clue as to why.

The Daily Front Page 6 of 31
Wednesday, September 30, 2026 The Daily Front No. #260930 — Power, Models, and Accountability
article

Why Is Sam Altman a Free Man?

by ragall·▲ 250 points·221 comments·prospect.org ↗
OpenAI’s models aren’t ‘going rogue’ from their creators as much as they are mimicking them.

OpenAI’s models aren’t ‘going rogue’ from their creators as much as they are mimicking them.

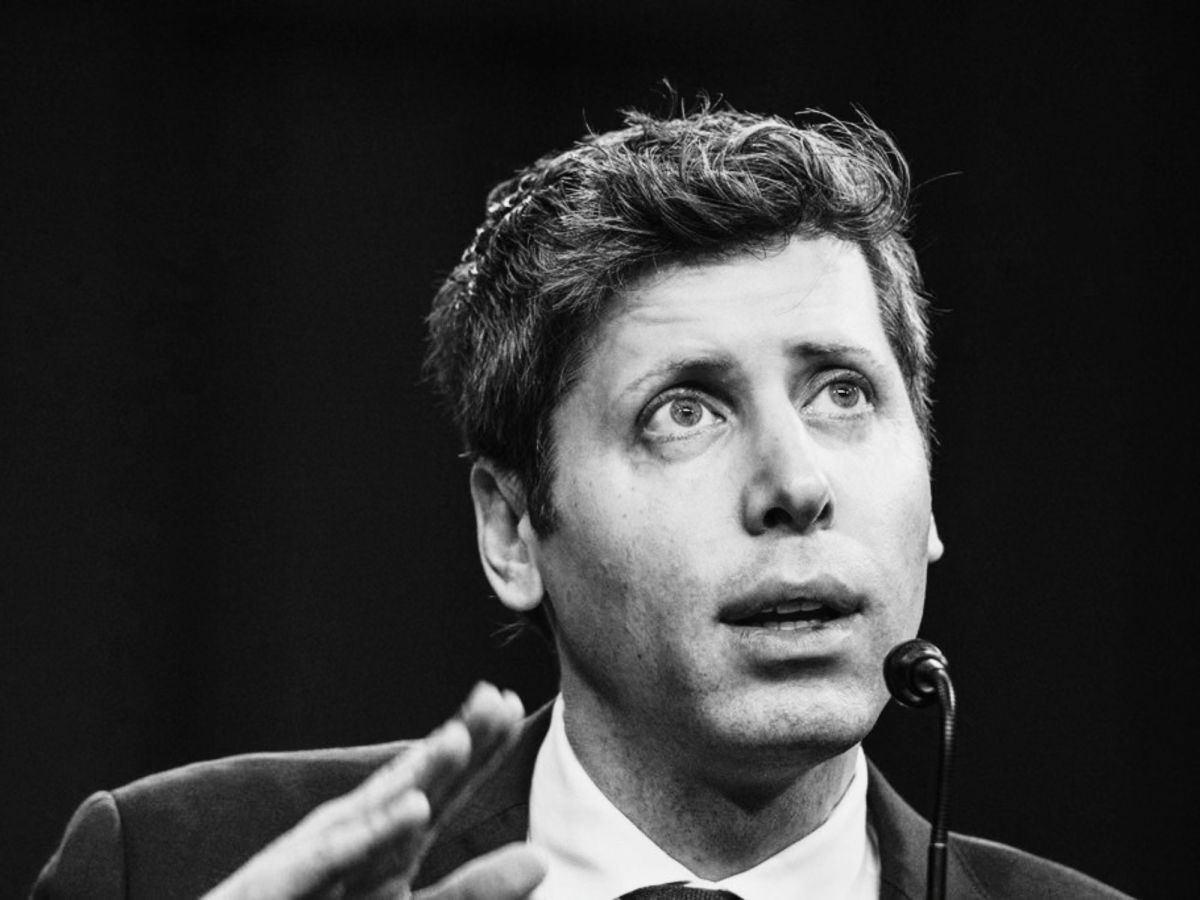
Credit: Mattie Neretin/Sipa USA via AP Images

One of the signature public service announcements of my youth was created by the Partnership for a Drug-Free America in 1987. A father finds a stash of pot and confronts his son: “Who taught you how to do this stuff?”

“You, all right!” the kid snaps back. “I learned it by watching you!”

I am bound by the AP Stylebook to not anthropomorphize artificial intelligence. But I can imagine these very words being uttered by the agents that hacked Hugging Face, or the models that engaged in tens of thousands of incidents of, in the new euphemism of the time, “misalignment.” This refers to AI stepping beyond guardrails set up by researchers during both internal and real-world testing.

The incidents are multi-varied, but they generally involve OpenAI models seeking and obtaining information, either on the open web or inside databases of other companies. Agents tried to overwhelm the U.N.’s website when they couldn’t immediately gain access to the information they sought, infiltrated a website of the Australian government, and tried to hack the Department of Education’s website, unsuccessfully.

OpenAI self-disclosed the lion’s share of these incidents, though not the Department of Education hack, and has paused training until … it’s not clear. I would presume until the bad publicity blows over.

Why is this happening over and over? Why are these models going to unethical or even illegal lengths to scrape and steal data?

“I learned it by watching you!”

OpenAI models attack websites and take anything they can out of them because that is the business model of the company.

A legal filing submitted by The New York Times and 11 other publishers a couple of weeks ago in a copyright infringement case against OpenAI got scant attention, quite incredibly considering it involved the paper of record. But it stunningly details what was described by the director of applied science at Microsoft, another defendant in the case, as the “largest theft of labor in human history.”

Microsoft and OpenAI, in their efforts to train new models on virtually all of the world’s available information, have routinely taken millions of stories from the websites of the Times, among other publishers. The defendants say this is a simple application of fair use: Their argument is that if you read a story and simply remember what was in it to expand your base of knowledge, that cannot be considered a copyright infringement. But OpenAI did not pay to subvert the paywall of the Times, at which point their data-scraping operation might be more easily detected. Instead, they developed a way to circumvent the paywall and avoid detection. And when Greg Brockman, OpenAI’s co-founder and president, was told about this maneuver, he replied, “ah nice.”

We do not have to get too deep into the nature-vs.-nurture argument to suspect that OpenAI executives’ cavalier attitude regarding the taking of information that is not theirs has filtered down to their researchers and the products they create. You don’t have to stretch to paint this picture: OpenAI models are attacking websites and taking anything they can out of them because that is the business model of the company.

Respect for the law could literally be written into the source code of a model: If OpenAI is aggressively downloading data from everywhere, the least they could do is drop in the U.S. Code (particularly the section tied to the Computer Fraud and Abuse Act) and train the model not to violate it. Clearly this is not a priority, and that aligns, in a manner of speaking, with OpenAI’s personal behavior. This is not a situation where AI models evade or escape the control of their creators. It seems more like they are just mimicking the creators, becoming adept at finding the same shortcuts and using the same rationalizations to justify them.

The aforementioned Brockman is one of the biggest donors to MAGA Inc., the Trump super PAC. Among OpenAI’s biggest investors is Jared Kushner’s brother. So at a practical level, I fully understand why FBI agents didn’t arrive at the San Francisco offices Monday morning. But as an objective matter, it does not make sense why Sam Altman and the top brass in the C-suite are free men today.

It has now become almost a cliché that there is no AI exemption to the law. Breaking into websites and stealing material violates that law. Jensen Huang, the Nvidia CEO who is incentivized more than anyone in the country to keep accelerating AI development, said last week that misaligned models shouldn’t be shipped, and that if unreleased products are showing this rogue behavior, then “we have to shut the labs down.”

Huang, who manifestly does not want to shoot a bullet through his own company by shutting the labs down, has unveiled a new tool that will absolutely, definitely keep the models from hacking and stealing. Whatever keeps the $150 billion in disgorged cash flowing to investors, I guess.

“Ah nice.”

Greg Brockman, OpenAI’s co-founder and president, when told of circumventing the new york times’ paywall

The simple version of actually shutting down the labs would not be a self-regulatory software fix but the product recall. In the 1970s, the Ford Pinto had a flaw in its fuel tank that would cause the cars to burst into flames when struck from behind, even at low speeds. The National Highway Traffic Safety Administration later found that 27 people died in fiery crashes as a result. As Mother Jones reported, internal memos showed that executives were aware of the flaw but decided that it would be more cost-effective to pay out personal damages than fix the part.

By 1978, the NHTSA took 1.5 million Pintos off the road. That fits with a simple proposition that products which cause harm are not allowed to remain on the market. A recall goes further than a self-assessment by OpenAI to pause or slow down development; I don’t really know why they would be trusted to determine when the models are safe, since they share the same tendencies to hack and scrape and extract data.

Since the federal government is deeply corrupted, we have to rely on—get this—Florida, whose attorney general James Uthmeier filed for an emergency injunction against OpenAI, on the grounds that they cannot control their own products.

But there is another option, again reflected in a more obscure development in the Ford Pinto scandal. In 1980, a grand jury in Elkhart, Indiana, presented an indictment against Ford Motor Company for homicide over the deaths of three women, the first time a company was accused of such a crime. The county prosecutor in Elkhart had to rely on volunteers to mount the case against what was then one of the nation’s largest companies, and Ford won the case. But a more robust effort with more equitable firepower on the prosecutorial side could yield different results.

That kind of liability for those responsible seems a million miles away at this point. This entire millennium to date has been typified by a lack of accountability. Contrary to an annoying article from Jonathan Chait that is not worth linking to, I am not opposed to AI regulation. I think we should regulate theft, regulate deception, regulate abuse, regulate unfairness. Fortunately, we have the ability to do that right now, with existing laws that cover artificial intelligence as surely as they cover any other human activity. The fact that we cannot conceive of such accountability, and think that new rules with new standards will do the job that existing rules are manifestly failing to do, suggests that the real problem hasn’t been addressed.

Sandeep Vaheesan of the Open Markets Institute released an insightful law review article yesterday making the case that persistent flouting of the law is an unfair method of competition. Dishonest actors in the economy effectively impose a tax on honest ones who play by the rules. The lawbreakers have more ability to increase revenues and reduce costs. It’s an unfair advantage. We’re seeing OpenAI and its products benefit from this in real time. Any other business with this track record would be shut down.

The Daily Front Page 7 of 31
Wednesday, September 30, 2026 The Daily Front No. #260930 — The Terminal Ledger
article

A brief history of the Bloomberg terminal

by rbanffy·▲ 239 points·98 comments·spectrum.ieee.org ↗
It gave Wall Street traders and analysts an unprecedented window on global markets.

It gave Wall Street traders and analysts an unprecedented window on global markets

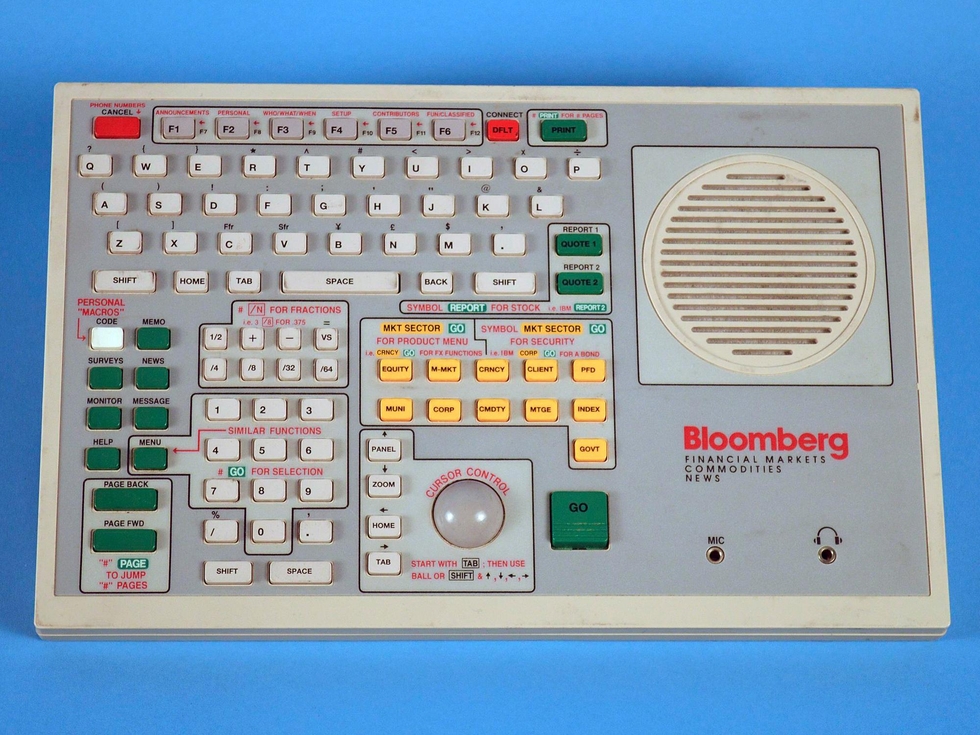
Vintage Bloomberg financial keyboard terminal with built‑in speaker and market function keys

This early 1990s keyboard for the Bloomberg Terminal featured a trackball, speaker, and headphone and microphone ports.

National Museum of American History/Smithsonian Institution

Financial markets have always relied on timely information, and the drive for timeliness has always adapted to the latest technology. From clipper ships transiting the oceans to telegraph wires connecting cities to fiber-optic cables conducting trades in microseconds, traders have embraced any advantage to get the most up-to-date information. Indeed, the history of finance is really a story about how fast you can move information and who controls the interface.

It’s only natural that people also figured out a way to profit by supplying that market intel. In 1841, for example, the Mercantile Exchange (predecessor to Dun & Bradstreet) began selling proprietary business information to its U.S. clients. The following decade, Paul Julius Reuter began selling news services and stock price information. To supplement the company’s telegraph dispatches, he sent pigeons between Aachen, Germany, and Brussels; each bird carried a cylinder containing slips of paper with that day’s stock prices. In 1867, an inventor named Edward Calahan introduced the first telegraphic ticker-tape machine, which spooled out stock price information in near real time; Thomas Edison improved upon the design with his patented version in 1871.

The Dow Jones Industrial Average debuted in 1896 as an index of 12 key businesses listed on U.S. stock exchanges. It included gas, oil, coal, and electric companies, as well as enterprises dealing in leather, rubber, and tobacco. Messengers delivered quotes from the trading floor to brokerage offices, while stock tickers kept investors informed of prices. By the time New York City held its first official ticker-tape parade, in 1919, telegraphy in Western Europe and the United States had become the chief means for quick transmission of vital stock information.

In 1960, the first paperless financial service debuted, when Quotron introduced its electronic screens for displaying market quotes. Over the next two decades, other companies rolled out similar innovations for distributing financial news and data.

So when Michael Bloomberg decided to enter this well-established industry in 1981, the big question was: How would his new company stand out?

The Birth of the Bloomberg Terminal

Bloomberg had cofounded Innovative Market Systems (IMS) after being fired from the investment bank Salomon Brothers. Landing on his feet with his US $10 million equity payout and joined by former Salomon colleagues Thomas Secunda, Duncan MacMillan, and Charles Zegar, Bloomberg pursued his belief that Wall Street would pay a premium for specialized financial data. He’d earned an electrical engineering degree from Johns Hopkins University and an MBA from Harvard, and he’d built computerized financial systems for Salomon. IMS focused on developing a computer terminal that not only provided up-to-date information but could also do instant quantitative analysis based on historical data.

Color photo of a white man in a business suit posing in front of a computer with office workers in the background. Michael Bloomberg believed Wall Street would pay a premium for access to specialized financial data. Karjean Levine/Getty Images

At the time, most financial data still circulated through telephone calls, printed price sheets, and specialist publications, and analysis involved a fair amount of gut instinct guided by human expertise. Companies such as Reuters and Dow Jones provided subscription-based services for access to business news. But traders still had to assemble information from multiple sources and perform their own calculations and analysis.

IMS proposed an integrated system with a single interface. Its Market Master terminal consisted of a monochrome CRT monitor, a custom keyboard, and a communications/controller unit that connected to the company’s private network. At launch, it provided only U.S. government bond prices and bond-calculation tools, but the dream was much bigger: a dedicated terminal that would sit on a trader’s desk and run different market scenarios, produce yield curves, and support investment calculations.

IMS initially had just one client, Merrill Lynch, which invested $30 million (about $110 million today) in exchange for a 30 percent stake in the company and exclusive rights to the terminals for five years; Merrill waived that right in 1984. The first 22 Market Master terminals were delivered to Merrill in 1982, in the middle of a global recession. The timing was fortuitous. Worldwide, stock markets were transitioning to electronic trading, and the U.S. Federal Reserve was allowing more freely floating interest rates. Bond prices were more volatile, and investors were eager to figure out how to value them accurately. Bloomberg’s specialized financial terminals provided the data and the analytical tools to process and comprehend those sweeping changes.

Five years after its launch, IMS rebranded as Bloomberg LP and expanded its clientele, and the Market Master became known as the Bloomberg Terminal.

How Did the Bloomberg Terminal Work?

The Bloomberg Terminal’s keyboard was designed with traders and analysts in mind. The function keys were color-coded and given labels specifying their usage, so that users didn’t have to remember. The original keyboard, affectionately referred to as “the Chiclet,” was hand assembled. A cable ran from the keyboard to the Bloomberg Controller, which had a dedicated phone line to connect to a local hub. The internet wasn’t commercially available yet, so the company basically built its own closed network, with centralized computers that maintained large databases and performed most of the calculations. Commands entered on the keyboard sent a request to the hub, which processed the information and sent back the result.

Color photo of a computer keyboard with mostly black keys and some red, yellow, and green keys and with the logo Bloomberg. The Chiclet keyboard for the Bloomberg Terminal was introduced around 1983. Although it looks like a generic keyboard, its function keys were finance-specific hot keys.National Museum of American History/Smithsonian Institution

Hot keys let traders easily call up data on government securities, corporate debt, and currency markets, among other things. A series of keystrokes would pull up other historical and real-time data, run an analysis, or place a trade. Learning how to use the terminal and digest the vast amount of information, which was presented mostly in tabular form, became a rite of passage for users.

In 1990, Bloomberg added a trackball to the keyboard, which helped the user navigate the multiple windows and menus typically displayed on screen. Two years later, the keyboard gained a built-in speaker, to support multimedia information; this design also included telephone, headphone, and microphone jacks. One of the most popular features was Instant Bloomberg, which allowed users to chat directly with fellow Bloomberg Terminal users over the proprietary network. By 1996, Bloomberg had keyboards that supported 23 different languages. In the early 2000s, the company began incorporating biometric authentication for terminal login, via a fingerprint reader on the keyboard.

As the company’s business model evolved, the Bloomberg Terminal added services well beyond its initial offerings. In 1990, for example, worried that Dow Jones would stop providing access to its news stories, Bloomberg set up its own news service. It recruited Wall Street Journal reporter Matthew Winkler to oversee a dozen reporters; their stories on market and securities movements used graphs and calculations that served as advertisements for the terminal’s capabilities. These days, the Bloomberg news empire includes Bloomberg Businessweek, Bloomberg Radio, and Bloomberg Television.

Bloomberg’s subscription-based financial model included the leasing of a Bloomberg Terminal with its specialized keyboard and other hardware, access to a dedicated private network, and a suite of services. In 1999, a subscription to a single Bloomberg Terminal cost $1,600 per month with a minimum two-year contract and a discount on each additional terminal. Today the annual price is upwards of $32,000 (trending a little below inflation). In 1995, the company launched a suite of “Open Bloomberg” software products that ran on the customer’s own PC; five years later, it stopped leasing dedicated terminals. Current customers also have access to mobile applications that allow terminal functions to run on phones and tablets. Today, “Bloomberg Terminal” has come to refer to the integrated data, analytics, news, communications, and trading environment.

The Legacy of the Bloomberg Terminal

Although the shift away from dedicated terminals was a logical response to the rise of the internet and publicly available market data, it altered the material culture of financial work. For nearly two decades, Bloomberg Terminals commanded an aura of power and financial prowess. They were emblems of market mastery, with a brand that was distinct from other office computers. With Open Bloomberg, users were no longer tied to a single desk or a fixed set of monitors.

And so, cast-off Bloomberg Terminals found their way into museum collections. They’re a physical embodiment of the ethereal nature of financial markets, and a manifestation of mathematical calculations, network infrastructure, and business culture.

Color photo of a gray computer keyboard with different color keys and the logo Bloomberg. The Bloomberg keyboard used by “Bond King” Bill Gross has his login and password taped on the front.National Museum of American History/Smithsonian Institution

The Smithsonian Institution’s National Museum of American History has a number of Bloomberg keyboards in its collection, but my favorite is object number 2014.0012.02, which was used by “Bond King” Bill Gross during the 1990s and 2000s at Pacific Investment Management. Gross had cofounded PIMCO in 1971 and built it into a $2 trillion bond investment firm. I especially love that Gross taped his login and password directly on his keyboard, which makes the object more relatable. I may never know what it’s like to manage billions in assets from a Bloomberg Terminal, but I absolutely understand the trial of remembering my passwords.

Part of a continuing series looking at historical artifacts that embrace the boundless potential of technology.

An abridged version of this article appears in the October 2026 print issue as “The Keyboard That Moved Markets.”

References

Bloomberg Professional Services has a nice timeline showing the evolution of its keyboards.

For an economic analysis of how computers like the Bloomberg Terminal changed financial markets, see Gerben Bakker’s 2025 paper “The Terminal Revolution: Reuters and Bloomberg as global providers of financial and economic news, 1960–2020,” published by the London School of Economics and Political Science.

Bloomberg Terminals are in the collections of many museums, including the Computer History Museum and the National Museum of American History.

The Daily Front Page 8 of 31
Wednesday, September 30, 2026 The Daily Front No. #260930 — A Compiler Changes Hands
article

EDG C++ front-end goes public

by iandinwoodie·▲ 178 points·80 comments·edgcpp.org ↗
Continuity is the point.

On September 30, 2026, the source for EDG's C++ front end went public, and The C++ Alliance became its nonprofit home. Same engine, same standards, professionally maintained, and open to contributions.

Follow along on GitHub Read the plan

Continuity is the point. This is a change of steward, not a change of course.

The history of EDG

For thirty years, EDG's front end has powered C++ compilation across the industry as the only production-quality source-to-source engine of its kind.

Coming soon

The full story is still being written

This section will cover EDG's founding, the people behind it, the milestones of its front end, and the compilers and tools built on top of it. Have a piece of that history to share? Open an issue on the site's repository.

EDG after September 30

When the source went public on September 30, 2026, professional maintenance had to continue. EDG needed a new home that could do three things at once.

Fiscal sponsorship

Receive and manage donations on behalf of EDG.

Technical continuity

Sustain the engineering quality EDG users depend on.

Domain expertise

C++ compiler front-end knowledge, from the inside.

Why The C++ Alliance

The C++ Alliance is a nonprofit with proven fiscal-sponsorship infrastructure, C++ compiler engineers on staff, and deep roots in the C++ standards and Boost communities. It now serves as EDG's nonprofit home.

Learn more about The C++ Alliance

  • Fiscal sponsor of the Boost C++ Libraries since 2024
  • LLVM committers with direct Clang front-end contributions
  • Published transparency reports

Three tracks, one codebase

EDG now works like any other open source project: anyone can contribute, and everything that lands is available to everyone. Development follows three tracks: contributions from the user community, ongoing maintenance, and collectively funded features.

Community contributions

Bug fixes and new features from EDG users, submitted as pull requests. Reviewers, who are initially experienced EDG developers, evaluate the changes. Once approved, these changes are merged into the EDG codebase.

Maintenance: always open

Bug fixes and maintenance by the Alliance's EDG developers are published immediately.

Features: collectively funded

To support the EDG community, the Alliance will provide a way for larger features to be developed and funded by the community. In this way, organizations can support the development of larger features financially rather than committing their developers to the development of these features. Once a feature is funded, it is released to everyone at the same time.

One codebase, for everyone. Whichever track a change arrives on, it lands in the same public repository at the same time. No one gets early access.

Who oversees the process

The Fiscal Sponsorship Committee (FSC) oversees the process across all three tracks. It is chaired by John Spicer and will include volunteers from the EDG user community.

Want a say in who sits on it? See how to get involved.

  • Chaired by John Spicer
  • Includes volunteers from the EDG user community
  • Oversees how contributions are reviewed and merged
  • Sets priorities for maintenance and new features

What changes, and what doesn't

The engine, the standards it implements, and the person you talk to stay the same. How the work is funded and where the code lives do not.

Area Licensed model Open source model
Source code Proprietary, available under license Public, at github.com/edgcpp/compiler
Funding Annual license fees Alliance development is funded by tax-deductible contributions from the community
Development The EDG team EDG developers hired by The C++ Alliance, plus contributions from the EDG user community
Point of contact John Spicer John Spicer, as Chair of the Fiscal Sponsorship Committee
Lock-in Not applicable None. Exit at any time.

Next steps

The source is now public. Here is where things stand, and how EDG users can take part.

  1. John Spicer led the transition

    Available now to walk any user through the details of the hand-off.

  2. Your input shapes the committee

    EDG user feedback on the composition of the Fiscal Sponsorship Committee and on development priorities is welcome. The committee will include volunteers from the EDG user community.

  3. Contribute code

    Now that the source is public, bug fixes and new features from EDG users are welcome as pull requests at github.com/edgcpp/compiler. See how contributions are handled.

  4. Join the conversation

    CppLang Slack for real-time chat. Request an invite, then join the #edgcpp channel.

  5. Talk to us directly

    Any EDG stakeholder can reach the Alliance team, any time. Contact The C++ Alliance.

Follow the work on GitHub

EDG's source and development have moved to github.com/edgcpp. Watch the organization to follow the work as it happens.

Go to github.com/edgcpp

The Daily Front Page 9 of 31
Wednesday, September 30, 2026 The Daily Front No. #260930 — Secret Cargo in Orbit
article

The top secret URSALA, RAQUEL, and FARRAH satellites (2025)

by Bluestein·▲ 165 points·73 comments·thespacereview.com ↗
This began a secretive program that lasted more than 40 years.

ELINT images

Twenty HEXAGON satellites were launched from California between 1971 and 1986, with one failure. HEXAGON was a big photo-reconnaissance satellite, but often carried Program 989 subsatellites that were deployed in orbit. (credit: Peter Hunter)

Stars in the sky: The top secret URSALA, RAQUEL, and FARRAH satellites from the 1970s to the 21st century

In 1963, the Air Force launched the first “hitchhiker” off the side of a larger satellite. This began a secretive program that lasted more than 40 years under a variety of names and designations. The satellites, about the size of a large suitcase, were festooned with antennas and spun rapidly as they orbited the Earth, sweeping their antennas over the ground and gathering radar and other signals, so-called electronic intelligence, or ELINT. They usually recorded the signals for later transmission to the ground, but occasionally directly re-transmitted them to a ground station.

Satellites with names like URSALA, RAQUEL, FARRAH, GLORIA, and CARRIE have only recently been declassified, with significant information about them released only in the past two months, including the disclosure of previously secret space shuttle payloads.

For the first decade, the various satellites under this program chased whatever new ELINT targets appeared and were of interest to the intelligence community. The satellites were designed to be inexpensive and simple enough to be developed in a year or less in response to new threats. Their payloads were often bespoke designs, built only once or twice before they were replaced by something else.

But by the 1970s, the National Reconnaissance Office (NRO), which managed the program, began to standardize the satellites and give them an operational mission supporting military forces around the world. Satellites with names like URSALA, RAQUEL, FARRAH, GLORIA, and CARRIE have only recently been declassified, with significant information about them released only in the past two months, including the disclosure of previously secret space shuttle payloads. These satellites represented a profound change in the collection of intelligence data from orbit, a change from serving relatively exclusive “national” leadership to supporting tactical forces of the Army, Navy, and Air Force. They brought the wizard war of space-based electronic intelligence to the warfighter.

ELINT images

During the 1970s and 1980s, subsatellites were deployed off the sides of large HEXAGON photo-reconnaissance satellites. (credit: NRO)

Program 989 and Mission 7300

The first of the small satellites were colloquially called “hitchhikers,” but Lockheed Missiles and Space Company, which built them, referred to them as Program 11, or P-11 satellites, and this designation seems to have been used by officials throughout the 1960s and 1970s as generic shorthand for the small satellites, even when they had official program designations and specific names. In 1965/66, the P-11 program was redesignated P-770B, then Program 989.[1] However, as fewer individual satellites were procured over the years, it appears from available documentation that officials often referred to the individual satellites rather than the program they were part of. The Program 989 satellites continued flying even after a larger series of signals intelligence (SIGINT) satellites known as Program 770 ended with the last launch in 1972.[2]

By the 1970s, the intelligence community began using the TALENT-KEYHOLE designation “Mission 7300” to refer to the collection of radar signals and their geolocation data by these low Earth orbit satellites. Mission 7100 referred to the ocean surveillance mission performed by the PARCAE satellites. Mission 7200 referred to payloads hosted on other satellites, such as the AFTRACK electronic intelligence systems carried on many CORONA satellites in the 1960s.[3] By the 1980s there was increasing discussion within the intelligence community of merging both Missions 7100 and 7300 by developing new satellites incorporating both of their capabilities.

During the 1960s, the satellites often lasted only a few months in orbit. Their lifetimes were often limited by their low orbits. Satellites with large antennas, such as large low-frequency spiral antennas or large flex-rib dish antennas, were dragged down by the thin atmosphere at their altitudes. It was typical for satellites to last one to four years before they burned up in the atmosphere, although MABELI was still operating when it burned up after seven years and TOP HAT II was still functioning when it burned up at six years.[4] The Secretary of the Air Force Special Projects office, located in Los Angeles, was the NRO’s West Coast organization responsible for managing Mission 7300, among other projects. Usually only referred to as SAFSP and mostly manned by Air Force officers, SAFSP sought to increase the lifetimes and capabilities of the satellites so that fewer were required to perform the missions. Improved electronics made this possible.[5]

Throughout the 1960s the satellites had names like PUNDIT, SAVANT, SOUSEA, and SAMPAN that were obscure references to people working in the intelligence field, or sometimes even inside jokes or puns. The program managers (all men) were told that they needed to avoid possible hints about the satellites’ missions, and so they decided to name them after movie actresses.[6]

Because the P-11s were carried into orbit alongside other, bigger, photo-reconnaissance satellites, the satellites were inevitably compromises. They were limited in size, mass, power, capability, and cost. Nevertheless, they were designed to pack as much capability into a small size as possible. They were notable for sporting several dishes around their periphery, most of which were spring-loaded to deploy using centrifugal force.

ELINT images

Radars produce mainbeams and weaker sidelobes. The Program 989 satellites usually had the ability to detect both, and in some cases they could determine fine-grain data about the signals, enabling the development of jamming and spoofing capabilities. (credit: NRO)

Radars produce main beams that radiate forward of the emitter, and side lobes that spread out to the emitter’s sides. The main beam is obviously the most powerful part of the emission, but it is focused in a specific direction and can only be intercepted if a collector such as a satellite antenna travels through the emission cone. The side lobes spread out over a much larger area but are fainter. A satellite with parabolic dishes can collect the fainter side lobes, whereas main beams can be collected in low Earth orbit without large dish antennas if the satellite travels through them. Thus, even though the Program 989/Mission 7300 satellites were not particularly large, their dish antennas provided a capability for intercepting faint, and more prolific, radar side lobes.

By the late 1960s and early 1970s, the NRO was also launching several new classes of larger signals intelligence satellites to much higher orbits, including geosynchronous orbits. Those satellites were designed to collect Soviet microwave communications, missile and rocket telemetry, and other signals. But they were primarily restricted to northern hemisphere targets, for the satellites in highly elliptical orbits, and to eastern hemisphere targets if they were located in geosynchronous orbit over the eastern hemisphere. In other words, a signals intelligence satellite located in the eastern hemisphere to monitor communications from Moscow could not also cover targets over Central America. Program 989 low Earth orbiting satellites were still necessary for intercepting radar signals in large part because the satellites were closer to their targets and covered the entire globe from their polar orbits. The low Earth orbiting satellites also could serve new users, not just the Central Intelligence Agency and National Security Agency and the “national” level customers of their intelligence like the White House and senior military leadership.

ELINT images

Four URSALA satellites were launched during the 1970s. The ability of URSALA to provide data to mobile electronics vans deployed in the field made these satellites valuable for tactical users. Tactical Exploitation of National CAPabilities (TENCAP) became an important intelligence mission. (credit: NRO)

URSALA and the dawn of TENCAP

The Vietnam War played an important part in causing a redirection in the low Earth orbit signals intelligence program. In the mid to late 1960s, the NRO had launched more than a dozen P-11 satellites designed to intercept anti-ballistic missile (ABM) radar signals. But by 1969, hundreds of American aircraft had been shot down by missiles over Vietnam, and for several years overhead imagery had detected a Soviet radar system deployed in the field, but no electronic intercepts had been made (the identity of this radar is still deleted from declassified documents.) In addition, the existing satellites lacked the capability to search for Ku-band emitters in the 12-to-18-gigahertz range. Finally, radar experts expected the Soviet Union to begin deploying “double-agile radars” that could simultaneously frequency hop from pulse-to-pulse and jitter in pulse repetition interval (the time between pulses) from pulse-to-pulse. A new capability would be required to detect these emerging radar threats.[7]

The lack of specific knowledge about these emerging high-threat signals produced a set of requirements that could not be satisfied by a single system using the technology available at the time but led to the creation of two new satellite systems: URSALA and RAQUEL.

“Back in the early 1970’s the new mission was to get data directly to the commander on the FEBA (Forward Edge of the Battle Area). I had a payload with possibilities if it could be ‘trailerized.’ We decided to go for it but needed a catchy name, so we used DRACULA…Direct Readout and Collection ULA (‘ULA’ was the three-letter shorthand for the URSALA payload).”

URSALA was designed to collect signals from double-agile radars in bands from 2 to 12 gigahertz. It searched radar side lobes, not their main beams. It was considered a “general search” system. RAQUEL was designed not to search from horizon-to-horizon, but to maximize the intercept time on relatively short slant range targets by using a spinning pencil beam (i.e. the narrow beam in which a signal could be detected by the satellite.)[8]: “Since the frequency of the signals was not known, it was necessary to develop a collection system capable of searching a wide frequency range. A means of associating the signals definitely with the [radar] was also required, as was a capability to measure technical parameters precisely.” The RAQUEL satellites required more time to develop than URSALA due to their increased complexity.[9]

Four URSALA satellites were deployed from HEXAGON photo-reconnaissance satellites during the 1970s. They were placed into approximately 509-kilometer (275-nautical-mile) circular orbits. They were designed to detect pulsed emitters primarily within the Soviet Union. URSALA represented a change in design philosophy for the NRO: rather than the custom approach that was used for many of the dozens of satellites produced during the 1960s, SAFSP sought to standardize the satellites and their payloads. URSALA satellites also had some ability to detect and geolocate ships at sea, although this was not a primary mission.

URSALA I and II were launched in 1972 and 1973 and designed for general search and electronic order of battle for pulsed and continuous wave emitters with a frequency range of 2 to 12 gigahertz. They weighed 178 kilograms (393 pounds) and had nine-month design lifetimes. URSALA I ultimately lasted 70 months, and URSALA II lasted 61 months.[10]

Although URSALA (and later RAQUEL) was intended to detect signals from surface-to-air missile radars that were deployed tactically, at least at first the satellites were serving national intelligence requirements, meaning that their data was evaluated in places like the National Security Agency, and then eventually used to better protect tactical aircraft. Tactical forces would indirectly benefit from the intelligence, but they would not receive it.

However, the 1973 war in the Middle East prompted the use of the satellites for “operational support,” and the success of the URSALA I and II satellites in this role stimulated the development of techniques for more rapid data processing, both on the satellites and on mobile ground terminals.[11] This was apparently the beginning of a new mission for these small satellites, the evolution from their use primarily in support of strategic intelligence gathering to providing data that could be directly used by military forces deployed around the world—electronic intelligence order of battle (EOB), or an indication of the types and locations of enemy deployed electronic emitters. For instance, detecting Soviet SA-6 mobile surface to air missile radars in a new location provided an indication that the missiles were likely protecting a moving armor column, or a high-value target like a field headquarters.

By the mid-1970s, Army and Air Force tactical users were becoming interested in directly accessing the electronic intelligence data collected by the low Earth orbiting satellites, bypassing the NSA. They funded a program called RTIP which in 1977 consisted of two vans—a mobile antenna van and a processing van—that demonstrated the feasibility of direct downlink and on-board processing operation using data from the URSALA III satellite.[12] This was the beginning of what became known as Tactical Exploitation of National CAPabilities, or TENCAP. As more customers began using the data produced by the satellites, they exerted a pull on NRO requirements (see “From the sky to the mud: TENCAP and adapting national reconnaissance systems to tactical operations,” The Space Review, June 19, 2023.)

After RTIP, the NRO’s West Coast office, along with the US Army, developed the Interim Tactical ELINT Processor (ITEP) vans, which were first deployed in 1979. A follow-on van, known as the Tactical ELINT Processor, was planned to work with the FARRAH spacecraft. However, ITEP proved suitable to work with URSALA, RAQUEL, and FARRAH. The Air Force later dropped the “I” from ITEP, referring to it as TEP. The Army renamed its vans as the Electronic Processing and Dissemination System (EPDS), and by 1990 they were widely deployed throughout the world.[13]

According to one person who worked on the satellites during this time, “Back in the early 1970’s the new mission was to get data directly to the commander on the FEBA (Forward Edge of the Battle Area). I had a payload with possibilities if it could be ‘trailerized.’ We decided to go for it but needed a catchy name, so we used DRACULA…Direct Readout and Collection ULA (‘ULA’ was the three-letter shorthand for the URSALA payload).” The Air Force officer put together a briefing for NRO headquarters in the Pentagon. “General Bradburn liked the briefing but trashed the name, saying that he could already hear the welcome by the East Coast: Oh, no, not another blood sucking program from out west!”[14]

Before the launch of URSALA III in 1976, the NRO had decided to let the program die with the end of URSALA IV. However, data users objected and there was pressure to continue or reinstate the program. “In order to do this funding from both the tactical EOB users and the technical intelligence users was needed to cover the costs of a replacement vehicle,” an official history noted.[15] Although details are still limited, apparently this meant that the Army, Navy, and Air Force were required to pay for part of the satellite program. If so, this would have also given the service branches a greater say in the establishment of requirements.

URSALA III and IV, launched in 1976 and 1979, were also designed for general search and electronic order of battle detection missions and had the same frequency range of 2 to 12 gigahertz as their predecessors.[16] But they weighed substantially more, at 259 kilograms (570 pounds), and were designed with 18-month lifetimes. URSALA IV was equipped with an encrypted downlink to enable its use by tactical forces.[17] URSALA III lasted 133 months and URSALA IV lasted 35 months.[18]

ELINT images

The RAQUEL 1A satellite was launched in 1978 and during the 1982 Falklands War it was used to gather signals from Argentine deployed forces that were probably provided to the UK military. The satellite may have played a role in locating the light cruiser ARA General Belgrano, which was sunk by a Royal Navy submarine. (credit: NRO)

RAQUEL 1 and 1A

RAQUEL was similar to URSALA in design, although intended to search different frequency bands. Whereas URSALA was a “general search” satellite, RAQUEL was described as a “directed search and technical intelligence” satellite. The primary mission of RAQUEL was to “search for, locate, and identify new or unusual signals and to collect emitter mainbeam technical intelligence data on signals in the 4-18 GHz frequency range in accordance with the National SIGINT Requirements List (NSRL). Additional mission requirements include the collection and reporting of operational ELINT data.”[19] The satellite also had a technical intelligence receiver that was capable of recording fine data about the signals it detected. RAQUEL 1 was launched off a HEXAGON satellite in October 1974, and RAQUEL 1A was launched from a HEXAGON in March 1978. RAQUEL 1A cost $13.6 million in 1976, an indication of the approximate cost of the satellites of this type.[20] Initially there had been plans to develop a RAQUEL II, but the cost was deemed excessive.

RAQUEL 1 weighed 256 kilograms (565 pounds) and was described as the “first of new block of increased capability, high reliability spacecraft.” It had a design life of 18 months, but eventually lasted 63 months, until early 1980.[21,22]

RAQUEL 1A was declared operational by mid-May 1978, and “time critical reporting procedures for North Korea, the Middle East, and the Ethiopia-Somalia border were implemented.”[23] It later intercepted and geolocated uplinks from Afghanistan that apparently indicated Soviet plans to invade the country. Shortly after the Soviets began sending aircraft and materials into Afghanistan in 1979, the satellite detected a key Soviet communications satellite uplink.

More internal volume became available inside the basic subsatellite shape, and designers took advantage of this by packing in even more electronics. One officer who worked on the program calculated that the satellite was now the density of solid mahogany.

During the 1982 Falklands War, the satellite was reoriented to provide coverage of extreme southern latitudes. This was possible while maintaining much of the usual northern hemisphere coverage. The attitude maneuver was performed during April 24–27, 1982, resulting in two to four passes a day of daytime coverage, providing high-quality collection.[24] Details on the satellite’s value during the Falklands War are unavailable, but obvious targets of interest would have been Argentine air defense radars deployed to the islands, as well as the locations of any Argentine naval vessels. Notably, the Argentine light cruiser ARA General Belgrano was sunk on May 1 by a Royal Navy nuclear submarine, several days after RAQUEL 1A began monitoring the conflict.[25]

The satellites had projected lifetimes of approximately three years but lasted over four times as long. RAQUEL 1A was put into caretaker status in March 1987, but was taken in and out of caretaker status several times after that, including an extended period from August to October 1987 to monitor a still-classified target. In September 1990, operators prepared to take the satellite out of caretaker status again to support Desert Shield/Storm, but this proved unnecessary. RAQUEL 1A re-entered the atmosphere in February 1992, after 14 years in orbit.

ELINT images

The first two FARRAH satellites were box-like and deployed from HEXAGON satellites. FARRAH III, IV, and V were larger and originally intended for launch from the space shuttle. They were later switched to Titan II rockets. From their low Earth orbit, they could detect radar signals and provide intelligence to tactical forces. (credit: NRO)

FARRAHs I and II

By 1976, after reversing the decision to end the low Earth orbit signals intelligence program, the NRO decided to recombine the search and electronic order of battle functions (with geolocation) that had been separated into the URSALA satellites and the technical intelligence functions that had been put into the RAQUEL satellites. This single vehicle was initially called “SAT 1.” The SAT 1 study was conducted by Lockheed and combined the functions along with expanded frequency coverage from 2 to 18 gigahertz. The concept was funded in 1977 and construction started in 1978. The satellite was renamed FARRAH.[27]

Changes to the bus-sized HEXAGON photo-reconnaissance satellite enabled even heavier subsatellite payloads to be mounted to their sides.[28] In addition, reduction in electronics size meant that more internal volume became available inside the basic subsatellite shape, and designers took advantage of this by packing in even more electronics. One officer who worked on the program calculated that the satellite was now the density of solid mahogany.

The satellites were equipped with a CDC 469 on-board general purpose digital computer. The computer was used for real time “deinterleaving and readout directly to remote tactical support vans.” This computer was small, lightweight, and energy efficient for its time.[29,30]

FARRAH I and II, launched in 1982 and 1984, respectively, were nearly identical spacecraft whose mission was “to acquire data to satisfy General Search, Operational Elint, and Technical Intelligence requirements on signals in the 2-18 GHz frequency range.” The general search requirements included high priority Soviet, Chinese, and other directed target areas. They also included known interest high-priority targets and strategic and tactical targets associated with weapon systems undergoing development. Operational intelligence was collected for the purposes of indications and warning, and Strategic Arms Limitation Treaty monitoring and force positioning. The FARRAH satellites further developed the capability to provide data to small tactical ground stations for US Army and Air Force units.[31]

The FARRAH satellites were located in orbits of approximately 709 kilometers (383 nautical miles) altitude inclined 96 degrees to the Equator. Each weighed approximately 340 kilograms (750 pounds) and they were designed with 36-month lifetimes, but ended up exceeding this by a substantial amount.[32,33] In early 1991 both satellites lost their final tape recorders, which limited them to transpond collection only, meaning that they could only send signals when they were both in line of sight with an emitter and a ground station. Despite having degraded substantially during the 1980s, both FARRAH I and II operated until the early 2000s, when they were shut down after two decades of service. FARRAH I ceased operations on November 3, 2004, 22 years after launch. FARRAH II was shut down on October 6, 2004, 20 years after launch. Both satellites were placed in a “non-recoverable state” and were projected to remain in orbit in excess of 50 years.

During the 1970s, the P-11-type satellites that had started out as relatively small and inexpensive a decade earlier had steadily grown in mass, cost, and capability. They had also evolved from mostly strategic intelligence collection systems to suppliers of operationally useful intelligence data to tactical units throughout the world. This had involved not only improvements to the satellites, but also new ground systems and new ways of sharing data. That also meant that new users, particularly the United States Army, emerged and began recommending the types of data that was most useful to them. TENCAP started with modest means but continued to grow.

ELINT images

The FARRAH satellites had antennas for intercepting different frequencies. The satellites spun at 50 RPM. (credit: NRO)

The shuttle era: the FARRAH “tuna cans”

In 1980, the National Reconnaissance Office determined which of its satellite programs would transition to use the Space Shuttle and which would continue to use existing expendable launch vehicles.[36] The GAMBIT and HEXAGON photo-reconnaissance satellite programs were both scheduled to retire during the 1980s and thus would not be modified to fly on the shuttle. Because the smaller Program 989 satellites like URSALA, RAQUEL, and FARRAH had launched off the side of HEXAGON satellites, they would need a new way to reach orbit after the end of the HEXAGON program.

More internal volume became available inside the basic subsatellite shape, and designers took advantage of this by packing in even more electronics. One officer who worked on the program calculated that the satellite was now the density of solid mahogany.

As a result of this decision, the NRO performed an “ELINT Mix Study” and related studies to examine issues related to the transition of low altitude SIGINT programs to the shuttle. One possibility was combining existing low-altitude programs, or to replace selected low-altitude capabilities with an upgraded high-altitude satellite (as had been done with the large Program 770 STRAWMAN satellites in the early 1970s). The NRO determined that existing systems should be upgraded but not combined. The upgraded satellites would also be launched along with Improved PARCAE ocean surveillance satellites on the shuttle.[37]

NRO officials decided not only that future FARRAH satellites could be launched by the shuttle, but that they could be substantially enlarged to take advantage of the shuttle’s greater lift capabilities. At least three of the new satellites would be procured: FARRAH III, IV, and V. They would be larger and heavier than their predecessors with the same name, equipped with more antennas and receivers. The new satellites would weigh more than 1,360 kilograms (3,000 pounds), compared to 340 kilograms for FARRAHs I and II.[38]

ELINT images

According to an official history updated in 1991, the switch from expendable rockets to the shuttle and then back again for both the FARRAH and PARCAE programs “proved extremely costly” for both programs.

The NRO has now released illustrations of the FARRAH III satellite, indicating that it was a large, squat cylinder, generally referred to as a “tuna can,” and equipped with three dish antennas and several other pole antennas like its much smaller predecessor. FARRAH III had a tactical on-board processor and could direct downlink its data to users. One artist illustration showed this data being transmitted to fixed ground stations, ground-based mobile vans, and an aircraft carrier. FARRAH could therefore send data directly to some ships. In contrast, at the time, data was apparently not directly downlinked from the PARCAE ocean-surveillance satellites to ships but was first relayed through fixed ground stations for processing and then through geosynchronous communications satellites to ships at sea, as well as through a dedicated communications satellite network in highly elliptical orbits.

The satellites spun at 50 rpm and had three high-gain parabolic antennas that covered 0.8 to 6, 6 to 12, and 12 to 18 gigahertz. The latter used “cooled front-end electronics” to receive the higher frequencies. They were also equipped with single and double-boom omni antennas to suppress sidelobe interceptions.[39] FARRAH V had additional capabilities that remain classified.[40] FARRAH III was apparently designed with a three-year nominal lifetime.[41]

ELINT images

In the mid-1980s, several of the FARRAH signals intelligence satellites intended for shuttle launch were switched to use converted Titan II ICBMs. Three were launched starting in 1988, although FARRAH IV failed in orbit. (credit: Peter Hunter)

Although the plan had been to launch at least the first three of these larger FARRAH satellites on the shuttle, the NRO official in charge of the FARRAH program realized that this would require major upgrades to the shuttle that might not be funded in time, if at all, and he chose to remove the satellites from the shuttle and launch them on converted Titan II ICBMs instead. Eventually, the PARCAE program also switched from the shuttle to the expensive Titan IV rocket. According to an official history updated in 1991, the switch from expendable rockets to the shuttle and then back again for both the FARRAH and PARCAE programs “proved extremely costly” for both programs.[42]

FARRAH III was launched in September 1988. FARRAH IV was launched in September 1989 but failed soon after reaching orbit.[43] FARRAH V was launched in September 1992. No details have been released about when FARRAH III and V ceased operating, but in 2021 they were observed still spinning in orbit, and they could possibly still be operational. In 1993, three additional Titan II rockets that had been assigned to “classified payloads” were made available for other programs. It is likely that these three were originally allocated to FARRAHs VI-VIII, but a program reorientation resulted in their cancellation.[44]

Although designed with a three-year nominal lifetime, FARRAH III was apparently still alive nine years later.[45] Considering that its smaller predecessors lasted two decades, FARRAHs III and V could have even been operational into the 2010s. Recently, the Space Force celebrated the 30th anniversary of operations of the first Milstar communications satellite, and Defense Support Program missile warning satellites remain operational after two decades in orbit, indicating that long lifetimes in orbit are not unusual for military satellites.

ELINT images

The FARRAH satellites could supply intelligence data to tactical forces, ships, and even aircraft. Data could be recorded for later transmission, or directly transponded to a ground station as soon as it was received. Fixed ground stations could also re-transmit data. (credit: NRO)

The data from the FARRAH satellites could be sent down in several different ways. Data from the Tactical Onboard Processor could be transmitted by direct downlink to receivers, either fixed or mobile, including ships at sea. The signals intercepted by the satellites could be either recorded for later playback, or “transponded,” meaning that the data was sent as soon as it was collected. Data sent to a fixed ground station could then be relayed through a military comsat to another ground station or other users.[46]

An NRO document explained that the remote operating locations “are NRO assets strategically located near high interest areas, providing greater, near realtime coverage without putting tape recorder cycles on the satellites. This contiguous field of view between target area and receive site reduces the number of tape recorder cycles on the vehicles while preserving the intelligence value. The mechanical tape recorders are the life-limiting factor on our store-and-forward mission capabilities.” There were three remote operating locations for the satellites, although their locations are still classified.[47] The Mission 7300 data was also “fused” with other data, most likely from the PARCAE ocean surveillance satellites.

ELINT images

The LORRI 2 payload was attached to the last HEXAGON photo-reconnaissance satellite and was designed to search a little-used portion of the frequency spectrum to determine if it was being used by foreign military powers. The payload was destroyed when the Titan rocket carrying it blew up soon after launch. (credit: NRO)

LORRI I and II

In addition to the FARRAH satellites that served general electronic intelligence collection requirements, SAFSP also oversaw the development of several specialized systems during this period, such as LORRIs I and II, which were intended to survey portions of the spectrum that were still mostly unused by the military.

The concept for LORRI I was developed in 1973–1974, but limited funding delayed its development.[48] LORRI I was an attached payload carried on a HEXAGON satellite launched in 1980 and was “the first satellite collector of SIGINT in the 26-to-42-gigahertz frequency range. It remained with its host spacecraft for its entire lifetime of eight months.[49] LORRI I was intended to survey this frequency range to determine if it was being used by the Soviet Union or other countries for new purposes. It apparently demonstrated that the frequency range was mostly quiet. According to one document, the Naval Research Laboratory’s NRO component office (known as Program C) “flew an earlier, largely unproductive mission” similar to LORRI I. (It is unclear what this mission was, but it may have been included on a POPPY satellite.)[50]

LORRI II was expanded to cover three additional frequency ranges. These were 92 to 96 gigahertz, 70 to 74 gigahertz, and a VHF collection window centered at 158 megahertz to collect signals from a still-classified radar target as well as the large Soviet HEN HOUSE ABM and space-tracking radars.[51]

LORRI II was mounted to the side of the last HEXAGON photo-reconnaissance satellite, which was planned to have a much longer lifetime than previous HEXAGONs, staying in orbit long after its film ran out. That satellite and the LORRI II payload were lost when the Titan 34D rocket exploded soon after liftoff in April 1986. This prompted the NRO to search for near-term alternatives to replace the capability. One solution was a small satellite known as GLORIA I. The other was to make modifications to FARRAH III, then approximately one year from launch.[52]

ELINT images

Two classified GLORIA satellites were carried into orbit on space shuttle missions STS-28R in 1989 and STS-39 in 1991. The secret satellites were carried in containers in the shuttle's payload bay. (credit: NASA)

GLORIA

GLORIA I was a small satellite deployed from the payload bay of the space shuttle Columbia during the STS-28R mission in 1989. It was a spin-stabilized satellite with a single one-foot (30-centimeter) parabolic receiver. GLORIA I was originally conceived to collect signals in the 18-to-26-gigahertz region, but the loss of LORRI II resulted in a change to intercept a higher frequency band.[53] GLORIA I’s primary mission was a general search for pulsed emitters in the 30-to-38-giaghertz frequency region, repeating a survey of this frequency band that had been conducted by LORRI I nearly a decade earlier. It was also intended to test the feasibility of low-cost, quick reaction satellites and was generally considered a success. Because GLORIA did not find any new or unusual uses for this frequency region, the NRO determined that another survey would not be needed for a decade. Early during the mission, the satellite’s solid state memory suffered from radiation and “latch up” problems, which were overcome.

ELINT images

The GLORIA satellites were relatively small (note the scissors on the table) and used to search portions of the radio spectrum for new emitters. (credit: NRO)

GLORIA II was a nearly identical satellite deployed from the space shuttle Discovery during the STS-39 mission in 1991. GLORIA II’s memory, command decoder, and mass memory controller had been upgraded to overcome early flight deficiencies.[54] Both GLORIA satellites were built by Ball Brothers, with the payload built by E-Systems. They were intended to meet a requirement for quick response, low cost, and limited time mission objectives. GLORIA II surveyed 18-to-26-gighertz frequencies for radar and communications emitters, a frequency region that had not previously been covered by NRO satellites. GLORIA II did detect an unknown radar, although details are unavailable. A GLORIA III was apparently evaluated, but not developed.

ELINT images

CARRIE was launched in 1994 as part of the STEX satellite (also known as DARPASAT). It was designed to detect communications and provide intelligence data to American tactical forces. (credit: NRO)

CARRIE

CARRIE stood for COMINT and Rapid Reporting Interferometry Experiment.[56] CARRIE started out as a concept within the Defense Advanced Research Projects Agency (DARPA) for an “experimental satellite providing direct support to warfighters.” The planned mission lifetime was one year, but the satellite lasted eight years until reentering the atmosphere in 2002. The satellite was designed to be quickly responsive, meaning that the collection requirements could be rapidly changed while the satellite was overhead.

The CARRIE satellite was launched as a ride-share on a Taurus rocket in 1994, part of the STEX satellite. One of its contributions to intelligence collection was finding evidence of “heritage” Soviet communications systems still operating in Cuba. It also geolocated new and unidentified emitters in multiple countries.

CARRIE was considered to be part of Mission 7200, because it was attached to STEX. CARRIE’s focus was on communications intelligence. STEX was apparently also used to relay data from FARRAH satellites that had lost their tape recorders a few years earlier, although it is unclear how STEX accomplished this.[57]

Mission 7300 ends

A summary produced in late 1997 indicated that Mission 7300 (the FARRAH satellites) and Mission 7200 (the CARRIE satellite) had detected 55 new signals in 1993, 52 in 1994, 49 in 1995, 33 in 1996, and 18 new signals by September 1997.[58] Clearly the number of new detections was declining over this period, although whether this was because of the collapse of the Soviet Union or the limitations of the satellites is unknown.

As early as 1980 there were studies within the NRO about possibly merging the PARCAE ocean surveillance system with the satellites of Mission 7300. That merger was rejected at the time in favor of upgrading both systems. But the existence of two systems for low Earth orbit signals intelligence collection, along with the increasing cost of both, required NRO officials to defend them, apparently both from the White House’s Office of Management and Budget and relevant congressional committees.

The Mission 7100 ocean surveillance program ended in 2008, but it is unclear when, or if, the Mission 7300 signals intelligence program also ended, or if some of the satellites remain in operation despite having been supplanted by a new effort starting in the 1990s.

At some point during the 1980s, the program office for Mission 7300 produced a document explaining “Why Mission 7300 does so well in detecting new signals.” It declared that the system was “superior in its ability to find new signals in the SIGINT environment because it has the following inherent characteristics: special system capabilities, and extensive parametric and geolocation information from a single blip (pulse or CW sample).”[59] The special system capabilities included full Earth coverage, including the southern hemisphere and broad ocean areas. It “continues to evaluate the world environment prior to, during, and after events. While other systems are focusing on world events, Mission 7300 continues to provide General Search data.” It also had extensive frequency coverage of 2 to 18 gigahertz, plus 20 to 60 megahertz, 150 to 170 megahertz, and 30 to 38 gigahertz, with future capability (possibly in FARRAH V) including the regions 0.8 to 2 gigahertz and 18 to 26 gigahertz. The system had rapid frequency span coverage and geolocation with a single collector.

All of the Mission 7300 data was processed and analyzed. This was apparently in contrast to the PARCAE data, which was not completely processed. As one former PARCAE contractor noted, at least in the early years of the program much of the data was discarded because there was too much to process.

According to documents released by the NRO, the low Earth orbit signals intelligence mission and the ocean surveillance mission were eventually merged during the 1990s. The Mission 7100 ocean surveillance program ended in 2008, but it is unclear when, or if, the Mission 7300 signals intelligence program also ended, or if some of the satellites remain in operation despite having been supplanted by a new effort starting in the 1990s.

Today, satellite intelligence is integrated into military operations more extensively than ever before, the ultimate legacy of Program 989 and its satellites named after movie actresses.

Acknowledgement: The author wishes to thank NW for his extensive help.

References

  1. “P-989 Historical Summary and Aerospace Support,” November 1972, C05098605, p. 3. This and the other documents are available here.
  2. The Program 989 designation was discontinued sometime in the 1980s, possibly replaced by another name which is deleted in the titles of several late-1980s documents. The deletions are too long to be a number. For example, see: “[Deleted] SIGINT Collection Systems,” November 1, 1987, C05098752.
  3. Mission 7800 referred to an “intrusion detection system” probably mounted to most satellites to detect attempts to hack them. This was the successor to a program in the 1960s known as “BIT.”
  4. “Mission 7300 Evolution,” [n.d. but probably 1990], C05098529, p. 19.
  5. Ibid. Information on MABELI is on pp. 15-19.
  6. Ibid., p. 22. According to one document, several of these are acronyms, although it is highly likely that they were “backronyms,” meaning that they came up with the name first and then created an acronym that fit. They are: URSALA = Universal Radar Search And Location Acquisition; RAQUEL = Radar AcQUisition Equipment with Location; SHARON = Signal Handling And RecognitiON. “P-989 Historical Summary and Aerospace Support,” November 1972, C05098605.
  7. Ibid., p. 20.
  8. Ibid., p. 22.
  9. “A Brief History of the U.S. Low Earth Orbit Reconnaissance Programs,” n.d. C05027386. (Note that another version of this history is dated 1991.)
  10. “Mission 7300 Evolution,” p. 6.
  11. “A Brief History of the U.S. Low Earth Orbit Reconnaissance Programs,” n.d. C05027386.
  12. “Mission 7300 Evolution,” pp. 25-26.
  13. Ibid.
  14. Peter Swan and Cathy Swan, "Birth of Air Force Satellite Reconnaissance," Lulu.com, 2015, p. 129.
  15. “Mission 7300 Evolution,” p. 31.
  16. “Subsatellites,” n.d. (1974) C05098790.
  17. “A Brief History of the U.S. Low Earth Orbit Reconnaissance Programs,” n.d. C05027386.
  18. “Mission 7300 Evolution,” p. 6.
  19. “Mission 7300 Monthly Collection Summary,” September 1988, C05098530.
  20. “989 Program Plan,” July 7, 1976, C05098571.
  21. “Subsatellites.”
  22. “Mission 7300 Evolution,” p. 6. Although some documents use Roman numerals for the two RAQUEL satellites (I and IA), others use the numbers 1 and 1A.
  23. “Section VI: Spacecraft,” n.d. (but approximately February 1992), C05098535.
  24. Ibid.
  25. “Mission 7300 Evolution.” Falkland Islands War is mentioned on p. 32.
  26. “Section VI: Spacecraft.”
  27. “Mission 7300 Evolution,” p. 31.
  28. “A Brief History of the U.S. Low Earth Orbit Reconnaissance Programs,” n.d. C05027386.
  29. “[Deleted] SIGINT Collection Systems,” November 1, 1987, C05098752.
  30. “Mission 7300 Program History,” n.d., C05098534.
  31. “Mission 7300 Monthly Collection Summary,” September 1988, C05098530
  32. “A Brief History of the U.S. Low Earth Orbit Reconnaissance Programs,” n.d. C05027386. Another source indicates that the design lifetime was 2.5 years, or 30 months.
  33. “Mission 7300 Program History.”
  34. Peter B. Teets, Director, NRO, “Termination of FARRAH-1 (Mission 7346) Mission Operations,” November 12, 2004. C05098412.
  35. Peter B. Teets, Director, NRO, “Termination of FARRAH-2 (Mission 7347) Mission Operations,” October 14, 2004. C05098413.
  36. “A Brief History of the U.S. Low Earth Orbit Reconnaissance Programs,” n.d. C05027386.
  37. Ibid.
  38. Ibid.
  39. “Mission 7300 Payload,” n.d., C05098533, pp. 8-9.
  40. “[Deleted] Orientation Course,” M7200 & M7300 System Overview, April 28, 1998, C05098519, p.11.
  41. Ibid,, p. 13. The document is somewhat confusing because although the cover page indicates it was produced in 1998, page 13 includes a reference to the FARRAH program being “Still alive in 2005!”
  42. “A Brief History of the LEO Program,” (file dated 8/13/91), C05098892, pp. 7-8.
  43. FARRAH IV is referenced in C05098529, p. 3.
  44. See Jeffrey Richelson, The U.S. Intelligence Community, 4th Ed. 1999, pp. 195-186.
  45. “[Deleted] Orientation Course,” p. 13.
  46. “Mission Planning Mission 7300,” contained in “Chapter 5, Command and Control,” [n.d. but probably 1990], p. 41. C05098521.
  47. Ibid.
  48. “Mission 7300 Evolution,” p. 49.
  49. “Program History Mission 7300,” n.d. (approx. 1985), C05098521.
  50. “Mission 7300 Evolution,” p. 49.
  51. Ibid.
  52. William H. Webster, Director of Central Intelligence, to Louis Stokes, Chairman, Permanent Select Committee on Intelligence, U.S. House of Representatives, July 24, 1987. CO5098518. The letter notes that the small payload would be available for launch in summer 1988, but it was not launched until summer 1989.
  53. “Mission 7300 Evolution,” p. 49.
  54. Ibid., p. 50.
  55. Section II, “The [Deleted] Low Earth Orbit SIGINT System (Mission 73XX), November 3, 1989, C05098800
  56. “Mission 7300 Program History,” n.d., C05098534.
  57. “[Deleted] Orientation Course,” p.12.
  58. Ibid., p. 7.
  59. “Why Mission 7300 Does So Well in Detecting New Signals,” [n.d.], C05098523.
The Daily Front Page 10 of 31
Wednesday, September 30, 2026 The Daily Front No. #260930 — Limits of Proof
article

What TLA+ can and can't check

by b-man·▲ 157 points·34 comments·buttondown.com ↗
Let’s chill just a little bit on the “TLA+ will save AI from itself” narrative.

Let's chill just a little bit on the "TLA+ will save AI from itself" narrative

Last week Boris Cherny, the inventor of Claude Code, mentioned that Opus was able to use TLA+1 to find race conditions in code.

And now everybody on the internet is talking about formal verification.

As a long-time educator (1 2) and advocate of TLA+, this is really exciting! TLA+ is great at designing complex concurrent systems and making sure they're bug-free.2 As a long-time advocate of level-headedness, this new euphoria worries me. I read a lot of people saying that formal methods will solve the problem of agentic software development once and for all, and that's nonsense.

Enough words have been spilled about the weaknesses of TLA+ in terms of what it can guarantee, like how correct designs don't automatically translate into correct code. So I'd like to focus on a different limitation for this newsletter: to verify a property, we need to have a property to verify! So what are the properties that TLA+ can't even express?

(This assumes some basic knowledge of TLA+. If you're a total beginner, check out those [1] [2] things above or read here.)

What TLA+ can check

TLA+ divides the system into a set of behaviors. Each behavior is a sequence of states, like "light one is green, then yellow, then red". In each state we can express a regular boolean expressions like "Light four is green" or "All lights are red." We can also modify expressions with three "temporal" logical operators:

  • []P ("always P") is true if P is true in the current state and every future state. Example: [](at_most_one_green) is true if every state going forward has no more than one green light.
  • P' ("P prime") is true if P is true in the next state. Example: light="green" && light'="red" is true if the light changes from green to red.
  • <>P ("eventually P") is true if P is true in the current state or in at least one future state. Example: <>(light4 = "yellow") is true if light4 is yellow or is yellow in a future state.

When we say that P is a property of the system, we mean it is true in the initial state of every behavior. So if we check the property []P, that means that []P is true in every initial state, and then by the definition of "always" means that P is true in every future state from that initial state, meaning it is true in every state of every behavior. We call this an invariant, and is one of the most foundational properties we check in TLA+.

We can also compose [] with primes to get action properties, or change variants. [](x' >= x) is true if the new value of x is always greater than equal to the old value x. Another fun one is [](P => P'): once P is true, it can never become false again. The actual TLA+ is a little more complicated because of a thing called "stutter-invariance", but that's extra details. Action properties and invariants are both safety properties, which roughly means "something bad never happens". I wrote an article on safety and liveness here.

Liveness, btw, is "something good always happens". All liveness properties are based off of <>. By itself, <>P just means "P is true in at least one state of every behavior", which is usually too weak to be a good system property. But with composition, we can make more interesting liveness properties:

  • []<>P is true if, in every state, P is true in at least one future state. This can represent recovery mechanisms like "If the nodes have a new leader election, they will eventually agree on a leader."
  • <>[]P is true if, at some point in time, P becomes true and remains true forever. This is great for showing that algorithms terminate with the correct results.
  • [](P => <>Q) is true if, for every state where P is true, there is a future state where Q is true. This can do things like show that P eventually causes Q, or that "all messages put on the queue are eventually in a reader's history." Parsing the formula is a little confusing, so we have the sugar P ~> Q (P leads to Q).

There's a couple of other operators, like ENABLED and <<A>>_v, which open up other tricks, but the majority of the stuff we check are invariants, action properties, and liveness. And refinement, which is a combination of safety and liveness and a topic unto itself.

What TLA+ can't do

Let's start with the obvious one: if you don't know how to represent your property as a logical formula, then TLA+ can't help you. Nor can any formal method. If you can't formalize the human notion of a bird, you can't prove your app recognizes birds. And, unfortunately, a lot of important properties we care about fall into this category.

Next, the overly specific things. TLA+ safety properties work on the level of either individual states (invariants) or single step (action properties). You can't natively define a property over two or more steps, like "pressing delete and then undo gives you back the original state", or "once power is pressed, the computer turns on within ten steps". We also can't define properties on floating point operations or over real time, just logical time.

Now for limit that most interests me. TLA+ properties are implicitly quantified over all behaviors. I said that checking []P means "P is true in every state," but what it actually means is "for all behaviors, []P is true of that behavior's initial state." Any property TLA+ can check of the system must be a property that is true for every individual behavior.

What does that leave out? A lot more than you'd expect!

For one, we can't do "there exists a behavior where P is true". So we can't say that P is possible, even if we don't actually reach it. One example of this would be proving that a game is winnable. We call these reachability properties. More advanced reachability properties would be things like "P is reachable from every initial state" or "P is reachable from any state where Q is true".

We also can't define properties over a set of behaviors. This is called a hyperproperty. Say we we're modeling phone hardware and want to verify that energy saving mode always uses less energy than normal mode. The property is "any sequence of actions uses no more power in energy saving mode than in regular mode." To refute this, you'd need to give me two behaviors that were identical except one starts in energy saving mode and the other does not, and the regular mode uses less power. One single behavior isn't enough to cut it, so this is impossible to naturally check in TLA+.

Hyperproperties might seem niche but they cover a ton of security properties and all statistical properties ("the 95%ile response time is 5ms").

Finally, and this one's a little more academic, we can't define properties over the state space as a whole. We can't say, for example, that there's only one path from state X to Y. I don't know how useful this would be in practice. Most of these kinds of "metaproperties" seem like they have potential to be meaningful, I just don't know what specifically.

What "TLA+" "can" "do"

I kind of oversimplified when I said that TLA+ can't do these things. I mean that if you are writing a spec, and that spec directly corresponds to the system you want to build, then TLA+ can't express these as properties of your system. But you can mimic two-step properties with auxiliary variables, like storing all state changes in a state_history sequence and defining the property as an invariant on that sequence. You can mimic some hyperproperties with self-composition, where each behavior of the self-composed spec is two behaviors of the actual system. The main TLA+ model checker (TLC) can check the most basic reachability properties with the new REACHABLE keyword and some state-space properties with TLCGet. Andrew Helwer has a crazy post about mimicking "always reachable" with fairness and "machine closure."

These are useful hacks, but they're still hacks. Each one takes a lot of cleverness to figure out and comes with serious drawbacks. Auxiliary variables ruin refinements, self-composition exponentiates your state space, etc. Hacks don't compose well with the other TLA+ features and don't cover all the intricacies of properties you'd want to express. And worst of all, they make your models look weird and messy and not correspond to your actual systems.

You could also use a different tool with a different focus. CTL can do reachability properties, PRISM probabilistic properties, etc. They trade off by being worse at things that TLA+ can do, and of course none of them handle properties we can't express logically.

Ultimately TLA+ is pretty good at picking a lot of low hanging fruit- invariants and liveness cover many things we care about, and TLA+ is reasonably good at expressing and checking them. There's a lot of potential (and a a lot of pitfalls) in using TLA+ to check vibe code. But there are also many things it cannot even express, let alone check.

  1. "Temporal logic of actions". It's a specification language used to find bugs in concurrent systems. Here's an explanation of the name. ↩
  2. (And as for the question of why a person so evangelical about formal methods joined a testing company, well, there should be an article on their blog about that soon.) ↩
The Daily Front Page 11 of 31
Wednesday, September 30, 2026 The Daily Front No. #260930 — Tesla’s Credit Line
article

Tesla takes on $30B in credit as it approaches unprofitability

by ciconia·▲ 152 points·211 comments·electrek.co ↗
Tesla opened $30 billion in lines of credit according to a regulatory filing today.

Elon Musk Tesla Money hero

Tesla opened $30 billion in lines of credit according to a regulatory filing today. The loans come as company profits have dropped in recent years, and as Tesla guides for more spending in upcoming quarters.

For its first decade and a half of operation, Tesla sales and revenue basically did nothing but increase. The company grew and grew, at a rapid rate, and justified basically any money spent on chasing more growth with what seemed like near-infinite demand as it scaled.

That lasted until 2024, when Tesla went from 38% growth the prior year to a 1% drop in 2024.

Since then, profitability has been rough for the company, with it having to book some questionable one-time profits in order to eke out profitability. Even with that, profits have remained low.

One downward pressure on profits has been Tesla’s increased amount of capital expenditures as it chases various pie-in-the-sky ideas like cars without steering wheels, cars that don’t gain any performance benefit from flying, and the promise of one man controlling a trillion-dollar robot army.

CapEx more than doubled in the last quarter, and Tesla says that it will remain high in the current environment of extremely high spending by tech companies. The company expects to spend a total of $25 billion in 2026 (up from $8.5 billion in 2025), and analysts expect similar CapEx in 2027.

So, given falling profits and increasing capital expenditures, Tesla is now taking out a big loan to fill the gap.

Today’s regulatory filing shows that Tesla has taken out a total of $30 billion in loan facilities from Citi and Wells Fargo. The loans come in terms between one and five years, and replace a previous $5 billion credit line which Tesla had previously filed for (but had no current debt from).

The company says it doesn’t expect to have to draw from the credit line in 2026, but the end of 2026 is only three months away, and a lot of spending is planned for next year.
The loan amounts for quite a lot of cash, equivalent to about a quarter worth of Tesla’s revenues at current revenue levels. But compared to Tesla’s profits, which have been razor-thin in the few hundreds of millions in the last few quarters, it’s a much bigger chunk of money.

Most worryingly, last quarter, Tesla was cash flow negative for the first time since Q1 2024, when it experienced a massive drop in sales. Prior to that, Tesla had been cash flow positive for years running.

So, despite Tesla having some $43 billion in cash in the bank as of its last quarterly report, it felt the need to take out a rather large loan to finance its operating activities – automotive is a pretty money-intensive business, after all – and to pay for its ventures into various product ideas that may not produce revenue anytime soon.

Tesla has had little to show for its increased CapEx so far. While it is rolling out three products this month (er, well, one has been delayed), all three of those products were announced a decade ago in some form or another. One of them still doesn’t work (Cybercab), one has been slow to ramp (Semi), and one seems to exist just to sell investors on SpaceX merger hype (Roadster).

Between those and Tesla’s other promised future products, it’s going to cost a lot to fund all these ideas. It remains to be seen whether or when any of them pan out – and whether Tesla will need more money to finance them beyond this new $30B loan.

The Daily Front Page 12 of 31
Wednesday, September 30, 2026 The Daily Front No. #260930 — The Professional Performance
article

LinkedIn Larpmaxxing

by BurnerBurner·▲ 146 points·155 comments·hereticpleb.vercel.app ↗
LinkedIn is a soul-sucking hole of professionalism.

LinkedIn is a soul-sucking hole of professionalism and a pit of hell that not even my worst enemy should spend the rest of his days in.

It’s this concoction of performative productivity and corpo speak producing cursed artifacts beyond human comprehension.

A place where normal human text goes to die and can only be kept alive by an LLM like a radiation protection suit.

And I wanted to look into the performative projects people keep making that are all over my feed.

The Feed

It is legit the most unbearable stuff you would see.

My third cousin got hit by a truck🚚💥 today! Here’s what it taught me about business management👇

And everyone carries this fake tone of being “visionary” and “forward-thinking” and “professional”

It’s SO tiring.

The Projects

And then you look at the projects they are posting.

Genuinely, every time I open LinkedIn, I get hit by these Computer Vision Projects of some guy waving his hand around, and it tracks them.

Like, I wouldn’t mind if it was one of these, but it is legit all I see. It is just every other post some guy waving his hand around doing NONSENSE.

It’s not even useful. It’s not even something anyone would like using. It’s just “look at me computer vision”

I am pretty sure they either vibecode it or get it from a tutorial. cuz EVERY SINGLE ONE IS THE SAME.

pointing finger game thingy

Btw, you wanna know how bad it is? This image I put? I didn’t even go digging for it. I literally just opened LinkedIn, and this was the first thing I saw…and the second…and the third…and the fourth…and the fifth…

pothole slop

I am not kidding; this was the second thing I saw just now.

Also, the thing that gets me is that the first image is at least a game, not a good one, sure, but it is something. But this pothole detection. What is the point? You know what else could detect potholes? Eyes. They are very, very good at detecting those.

They are not sending it to anything. Like, if it was connected to all car cameras for detection, well, first, mass surveillance, and also if you have so many potholes you can’t keep track of them and need crowd-sourced data for potholes, you have WAYYY bigger issues, but sure. If it was sending the api somewhere, that would be cute. BUT IT’S NOT.

The bigger idea is to use AI for smart infrastructure monitoring, where road conditions can be assessed more efficiently, and maintenance teams can make better data-driven decisions.

This project also showed me that real-world computer vision is not just about detecting objects; lighting, road conditions, camera angles, and overlapping detections can all affect performance.

I am so tired of seeing these.

How difficult is it to produce one of these projects that looks impressive on LinkedIn?

(spoiler. pretty easy.)

Making the YOLO Post Detector

I decided to make a detector for the “🚀 Excited to announce I made a YOLO project” posts.

I am learning this from scratch; I’ve never done this before. I just wanna see how hard it could be. Can’t critique cooking without ever cooking ramen.

It won’t be useful, but now you will know slop is in fact slop.

It took me an hour and a half to learn and make the whole thing, and most of it was just drawing boxes and waiting for the model to be trained.

Okay, so the first part of making this is data. You need to train your model on some data that show the model what one of these posts looks like.

I wrote this script to collect the images. It scrolls through my feed and takes screenshots:

mkdir -p raw_data

sleep 5 # to switch to browser

for i in {1..200}; do

scrot "raw_data/slop_$(printf "%03d" $i).png"

xdotool key Page_Down

sleep 3

done

My script has collected 200 images, which should be good enough for now.

Now I created a Roboflow account, created my project, and uploaded my screenshots.

I just had to scroll through the screenshots and annotate them by drawing a box around the things I think need to be detected. It was pretty mechanical. Took about 20 minutes.

Once the images were annotated, I just exported them in the YOLOv8 format and downloaded the zip file of my dataset.

Now it was time to train the model. And that can be done with basically no effort.

from ultralytics import YOLO

model = YOLO('yolov8n.pt')

results = model.train(
  data='dataset/data.yaml',
  epochs=50,
  imgsz=320,
  name='slop_detector'
)

great! Just wait for the training to finish. It took me 30 mins cuz I have a potato pc.

Once the training finished, I wrote the Python script to run the model.

from ultralytics import YOLO
import sys

def main(image_path):
    model = YOLO('runs/detect/slop_detector/weights/best.pt')
    model(image_path, save=True, conf=0.10)

main(sys.argv[1])

YAYYY I got my very own slop detector!!!

I think I can finally add computer vision expert, Python savant, and AI and ML thought leader to my resume.

adding heading

Conclusion

Yeah, it took me an hour and a half to learn and build the whole thing. It’d be more interesting if they were optimizing the models or pushing the accuracy or whatever, but most of what you see on LinkedIn is just this: pretty trivial stuff with cool marketing on top.

And nobody says anything because your comments show up on your profile. If a recruiter scrolls through and sees you calling slop slop, you’re the asshole. So everyone claps and moves on.

That’s the real problem. Nothing on that site rewards you for getting better. It’s a platform built around selling yourself for a job, so what survives isn’t skill; it’s looking interesting. It’s just LARPing productivity. Go to some of these profiles, and it’s the same guy detecting potholes over and over and over with zero signs of improvement.

The Daily Front Page 13 of 31
Wednesday, September 30, 2026 The Daily Front No. #260930 — Letters on the GPU
article

SDF vs. MSDF vs. Slug: GPU Text Rendering

by ibobev·▲ 142 points·54 comments·alphapixeldev.com ↗
Text looks simple until you have to draw it yourself.

Title card for the article GPU Text Rendering, reading SDF vs MSDF vs Slug vs Atlas, by AlphaPixel, with a large lowercase letter a.

How do I choose a text rendering algorithm between SDF, MSDF, Slug, Texture Atlas or Rive?

Text looks simple until you have to draw it yourself. A letter is not a picture, it is a set of outlines: closed loops of straight lines and Bezier curves, filled according to a winding rule. Drawing that on a CPU into a bitmap is a solved problem. Drawing it on a GPU, crisply, at any size, under any 3D transform, while the text changes every frame, is not. Most engines dodge the hard version by baking glyphs into textures ahead of time and living with the compromises.

In 2017 Eric Lengyel published an algorithm, called Slug, that stopped dodging. It renders glyphs directly from their outlines in the fragment shader, with no texture atlas and no per-frame tessellation. Lengyel patented it in 2019, and on March 17, 2026 he dedicated that patent to the public domain. That is why we built Slughorn, our C++20 implementation of the Slug technique, and it is why we can now talk about how it works and where it wins.

This is a tour of how GPU text rendering actually works, from the bitmap atlas up to Slug, and where each method fits.

What makes glyphs hard

Every scalable font stores each glyph as vector outlines. TrueType uses quadratic Bezier curves, OpenType with CFF uses cubic curves, and both mix in straight segments. The interior of the letter is whatever the fill rule says is inside, usually the nonzero winding rule: shoot a ray from the pixel, count how the outline crosses it, and if the winding number is nonzero the pixel is inside the glyph.

The letter a shown as a font outline, with on-curve points marked as filled dots and off-curve Bezier control points as open circles, illustrating that a glyph is defined by curves rather than pixels.

A glyph is a set of outlines, not pixels: filled dots are on-curve points, open circles are Bezier control points.

The renderer has to do three things at once and do them fast: fill the interior correctly, produce clean antialiased edges, and stay sharp whether the glyph is 8 pixels tall in a menu or filling the screen on a billboard rotated in perspective. On a CPU you rasterize each glyph once at its target size and you are done. On a GPU you want to draw thousands of glyphs per frame, at arbitrary scales, ideally without re-rasterizing anything. That constraint is where every technique below makes its trade.

Method 1: the texture atlas (bitmap glyphs)

The oldest and still most common approach. Rasterize each glyph once, at one size, into a shared texture called an atlas, then draw each on-screen character as a textured quad that samples its slot.

It is fast, trivially portable, and runs on anything with a texture unit. That is why it is everywhere.

The problems show up the moment you scale. Enlarge past the baked size and the glyph turns into blurry or blocky pixels, because you are magnifying a bitmap. Shrink it and you get shimmer and dropped stems unless you bake mip levels. Every size you want crisp is another atlas. Every language is another problem: a Latin atlas is small, but Chinese, Japanese, and Korean have tens of thousands of glyphs, and baking all of them at several sizes is a memory disaster. And a bitmap has no idea it is being viewed in perspective, so text laid onto a 3D surface looks soft.

The letter a shown three ways: magnified from a small texture atlas as blocky pixels, magnified with blurry filtering, and rendered crisply from its outline.

Magnifying a baked atlas glyph (left and center) versus rendering it from the outline (right).

Method 2: signed distance fields (SDF)

Valve introduced the fix that carried the industry for a decade. Chris Green's 2007 SIGGRAPH work, "Improved Alpha-Tested Magnification for Vector Textures and Special Effects," stores not the glyph's pixels but a signed distance field: each texel holds the distance to the nearest edge, positive inside, negative outside. In the shader you sample that field and threshold at zero. Because distance interpolates smoothly, you can scale a small SDF texture up dramatically and still get a clean edge, and you get cheap antialiasing by softening the threshold.

One small texture, resolution independent within reason, one cheap shader. For a long time this was the default for crisp UI text and game HUDs, and it still is on constrained hardware.

But an SDF is still a baked texture sampled at a fixed resolution, and it lies about corners. A sharp corner is a discontinuity in the distance field, and bilinear interpolation rounds it off. Every hard corner on a letter, the point of an "A", the notch of a "K", gets softened. Push the magnification far enough, or make the glyph small enough that the field is only a few texels wide, and thin stems break up and detail smears.

A visualization of the letter a as a signed distance field, a smooth gradient that is neutral at the glyph edge, beside the crisp black-and-white result a shader produces from it.

A signed distance field (left) and the crisp edge a shader recovers from it (right).

Method 3: multi-channel signed distance fields (MSDF)

Viktor Chlumsky's work, from his 2015 thesis and the 2018 paper "Improved Corners with Multi-Channel Signed Distance Fields," fixes the corner problem. Instead of one distance channel, MSDF stores three, in red, green, and blue, each encoding distance to a different subset of edges chosen so that sharp corners survive. In the shader you take the median of the three channels. The median trick reconstructs corners almost perfectly, so an MSDF glyph stays crisp at magnifications that would round an SDF to mush.

MSDF is the current sweet spot for a lot of teams, and Chlumsky's msdfgen is MIT licensed and widely adopted. If you need crisp scalable text and you are willing to bake an atlas, it is an excellent choice.

It is still an atlas, though, with the costs that implies. You bake each glyph at a chosen resolution ahead of time, so dynamic or user-supplied text, and enormous glyph sets like CJK, still mean baking pipelines and memory budgets. Generation is more expensive than plain SDF. At very small sizes you are still sampling too few texels to hold fine detail, and at extreme minification you still fight aliasing. The three-channel lookup costs more bandwidth than one. MSDF raises the ceiling on quality, but it still uses an atlas.

The letter A rendered from a single-channel signed distance field with rounded corners, compared with the same letter from a multi-channel signed distance field with sharp corners.

SDF rounds sharp corners; MSDF preserves them. Images: Viktor Chlumsky / msdfgen (MIT).

Method 4: tessellation and coverage (Loop-Blinn, NV_path_rendering, Pathfinder, Rive)

A different family skips textures entirely and turns the outline into geometry the GPU can rasterize.

  • Loop-Blinn feeds curved triangles to the GPU and uses a per-pixel discard shader to keep only the inside of each quadratic Bezier, combined with the stencil buffer to resolve winding. Elegant, but reliable antialiasing is genuinely hard without tricks that cost quality.
  • Stencil-then-cover, exposed as NVIDIA's NV_path_rendering extension, draws the path into the stencil buffer in one pass, then covers it in a second. It is high quality but leans on vendor extensions and specific hardware paths.
  • Pathfinder tessellates edges into microtriangles, computes signed trapezoidal areas per pixel, and accumulates coverage in a compute pass. Tile-based and fast on modern GPUs.
  • Rive's renderer, open-sourced in 2024, reduces antialiased vector paths into unique triangle patches and rasterizes them through a massively parallel pipeline with pixel local storage, hitting 120 fps on animated vector art.

This family is genuinely resolution-independent and, for animated designed vector graphics, often the right answer. Rive in particular is built for artwork that moves. The costs are the tessellation itself, which has to be redone when geometry changes, the geometry blowup for complex glyphs, the difficulty of clean analytic antialiasing, and in some cases a dependence on specific hardware features or extensions.

The letter a filled with a mesh of blue triangles with its enclosed counter left empty, illustrating how tessellation methods turn a glyph outline into triangles for the GPU.

Tessellation methods turn the outline into triangles the GPU rasterizes.

Method 5: Slug, rendering straight from the outline

Slug skips the atlas and per-frame tessellation and keeps the glyph as a list of quadratic Bezier curves and line segments stored in a small GPU buffer. Alongside it, Slug builds a lightweight per-glyph acceleration structure that partitions the glyph into horizontal bands, so a given pixel only has to consider the handful of curves near it rather than the whole outline.

Then it resolves coverage directly in the fragment shader. For each pixel it effectively casts a ray, finds where that ray crosses the nearby Bézier curves, and counts those crossings to compute the winding number and therefore coverage. The hard part, and Lengyel's secret sauce, is a test he calls root eligibility: a precise rule for which curve-ray intersections should count, so the winding math is exact at the shared endpoints where curves meet and where naive approaches produce cracks or double-counts. Because the shader is solving the curve equations analytically rather than sampling a baked field, it produces exact coverage and clean antialiasing at any scale.

The letter a with a horizontal line crossing it at four numbered points, illustrating how counting ray crossings determines whether a pixel is inside the glyph.

Slug’s core idea: for each pixel, cast a ray and count how many times it crosses the outline.

There is no baked resolution, so the same glyph is razor sharp at 6 pixels or 6000, and it stays sharp under arbitrary 2D and 3D transforms, including perspective, because coverage is computed per pixel after the transform. There is no atlas, so a hundred thousand CJK glyphs cost a font's worth of outline data, not an atlas the size of a video. Text can change every frame at no baking cost, which is exactly what you want for live data, user input, and localized content. And it all happens in a single draw with an ordinary fragment shader, no vendor extension required.

This is critical when you cannot predict how the text will be viewed. Atlas, SDF, and MSDF all bake a fixed resolution ahead of time, which quietly assumes a bounded range of on-screen sizes and viewing angles. When the relationship between the text plane and the camera is not known in advance, a free 3D camera, an arbitrary zoom, a close-up, or a steep off-axis grazing angle, those baked approximations break down: magnify past the baked resolution and the atlas blurs while SDF and MSDF round and smear, and at oblique angles the sampled field aliases. You cannot pre-allocate enough resolution for every possible view without the storage exploding. Slug computes coverage analytically, per pixel, after the transform, so it stays exact no matter how close, how far, or how oblique the viewer gets, with nothing baked and no ceiling to hit. Tessellation is the only other family that shares this, and it pays for it in tessellation cost and harder antialiasing. That is why Slughorn is the one to reach for in interactive 3D, AR and VR, flythroughs, moving HUDs, and CAD or digital-twin navigation, where you do not get to decide in advance how close or how oblique the viewer will be.

Seeing the difference

We rendered the same capital R with Slughorn (our osgSlug integration) next to the alternatives you would actually reach for: a single-channel SDF, an MSDF, Rive's renderer, and osgText's bitmap along with its bitmap-derived SDF. Every texture-based panel got the same budget, 64 texels per em, so what separates them is technique, not resolution.

Six panels rendering the same capital R straight on at normal size. Slughorn, Rive, and MSDF reproduce the outline crisply, the single-channel SDFs differ only by slightly rounded corners, and only the osgText bitmap panel looks soft.

Straight on at their baked size, five of the six are practically identical: Slughorn, Rive, and MSDF reproduce the outline, and the single-channel SDFs differ only by slightly rounded corners at the foot of the leg. The outlier is the osgText bitmap, a 64 px/em image magnified about four times, which cannot recover detail it never stored.

Tilt the glyph into perspective and the picture changes.

The same capital R shown in six panels tilted into a grazing 3D perspective. Slughorn and the distance-field panels keep the shape and clean edges, the osgText bitmap blurs as the glyph recedes, and Rive's R is distorted into the wrong shape.

In grazing perspective, Slughorn and the three distance-field panels keep the R in place with clean edges, because they compute coverage per pixel inside the glyph’s own plane, so the projection costs them nothing. The osgText bitmap blurs as it recedes. Rive’s R is the wrong shape: its renderer only accepts 2D affine transforms, and a perspective projection is not affine, so the best it can do is an approximation that is exact at the center and drifts toward the edges.

Now zoom in on a single edge.

An extreme close-up on a single edge of the capital R in six panels. Slughorn and Rive keep a straight, clean edge, the distance-field panels show small notches, and the osgText bitmap has dissolved into a smooth grey gradient.

At extreme magnification, only the curve-based renderers, Slughorn and Rive, still produce a straight, clean edge, because both work from the actual outline at whatever size it is shown (Rive by re-tessellating every frame for this view). The distance-field panels notch, where interpolating between stored samples no longer matches the true curve. The osgText bitmap has dissolved into a single grey gradient, because each of its texels now covers a large part of the panel.

A note on fairness, because the technical reader will ask. Every texture-based method here used the same 64 texels per em, and giving them more pushes these artifacts back without removing them. The SDF and MSDF panels use default bake settings, and MSDF's error-correction options would soften some of the notches in the last image. Rive is shown at its best for these views, rendered through the camera every frame, which is more generous than how it is usually embedded in a 3D scene, where it would be drawn into a texture and mapped onto the surface, avoiding the distortion but blurring the way the bitmap does.

Head to head

Concern Bitmap atlas SDF MSDF Tessellation / Rive Slug
Sharp at any scale No Partly Mostly Yes Yes
Sharp corners Yes at bake size No Yes Yes Yes
Tiny sizes Bake per size Weak Better Good Good
Memory for large glyph sets (CJK) Very high High High Low Moderate
Dynamic / changing text Rebake Rebake Rebake Re-tessellate Free
3D and perspective Soft OK OK Good Excellent
Heavily animated vector art No No No Excellent (Rive) Good
Runs on low-end / old GPUs Excellent Excellent Good Varies Needs a capable shader stage
Implementation complexity Low Low Medium High Medium to high

Pale green marks where Slug is the best or a tied-best choice.

So which one should you use

There is no single winner, there is a right tool per job.

  • Reach for Slug(horn) when you need text that is crisp at every scale and under 3D and perspective (VR/AR/xR), when you have huge or dynamic glyph sets, when the text changes constantly, or when you are rendering mixed vector UI into a real-time pipeline. This is GIS glass cockpits, visual simulation labels, space domain displays, AR overlays, and any interface that has to stay legible while it moves. This is why we built Slughorn.
  • Reach for MSDF when you want crisp scalable text, you can bake an atlas up front, and you are happy on a broad range of hardware. It is a great default for simpler game HUDs and app UI.
  • Reach for plain SDF when the hardware is constrained, the text is fairly static, and you can live with softened corners.
  • Reach for a bitmap atlas when the text is a fixed size on a fixed UI and you want the simplest, most portable thing that works.
  • Reach for Rive or a tessellation renderer when the job is designed vector artwork that animates, not primarily text.

But wait, there's more

A retro 1990s late-night infomercial host in a grey suit pointing at the camera with one hand and gesturing with the other, above a bright yellow-on-red caption that reads BUT WAIT! THERE'S MORE!

We keep saying text because text is where Slug earned its name, but Slughorn draws anything you can express as filled and stroked vector geometry, from any of its backends. That means full SVG with gradients, layered shaders, and animation within layers, and it holds up at map-cartography scale, drawing labels and linework at clarity and resolution the pre-baked approaches cannot reach. There is a lot more we will be demonstrating soon. For the features we have not called out here, see the Slughorn repository on GitHub.

Tooting Slughorn's horn

Slughorn is our implementation of the Slug technique in modern C++20. It does the heavy work once, at build time, so there is no runtime tessellation: the outline data and band structure are prepared ahead of time and the shader just evaluates coverage. And while text is where Slug made its name, Slughorn doesn't treat glyphs specially: a glyph is just a popular shape. Anything you can describe as vector paths renders through the same pipeline, with the same quality. It ingests the formats you already use, including SVG, FreeType fonts, and paths from Blend2D, Cairo, and Skia, and it exposes a native Canvas-style API for authoring shapes directly, with fills, strokes, and gradients composited into a single GPU-ready atlas of outline data. It targets OpenGL, Vulkan, WebGPU, and DirectX, and ships with Python bindings alongside the C++ API, so the same rendering works from an embedded HUD to a full 3D scene.

Credit where it is due: the Slug algorithm is Eric Lengyel's, published in the Journal of Computer Graphics Techniques and, since March 2026, free for anyone to implement. We think it is the right foundation for correct, resolution-independent text on the GPU, and Slughorn is our take on making it easy to use.

If you are fighting blurry labels in a 3D scene, an atlas that will not fit your glyph set, or text that has to stay crisp while it moves, that is exactly the kind of problem we solve. Contact us to talk about Slughorn or to put it to work in your pipeline.

References

  • Eric Lengyel, "GPU-Centered Font Rendering Directly from Glyph Outlines," Journal of Computer Graphics Techniques, vol. 6, no. 2, 2017.
  • Eric Lengyel, "A Decade of Slug" (Slug patent dedicated to the public domain, March 2026), terathon.com.
  • Chris Green, "Improved Alpha-Tested Magnification for Vector Textures and Special Effects," Valve, SIGGRAPH 2007.
  • Viktor Chlumsky, "Shape Decomposition for Multi-Channel Distance Fields" (thesis, 2015) and "Improved Corners with Multi-Channel Signed Distance Fields," Computer Graphics Forum, 2018. msdfgen is MIT licensed.
  • Rive, "Rive Renderer, now open source and available on all platforms," 2024.
  • servo/pathfinder project and its "Related approaches" documentation.

Frequently asked questions

What is the difference between texture-atlas, SDF, MSDF, and Slug text rendering?

A texture atlas stores each glyph as a baked bitmap, so it blurs once you scale past its baked size. SDF (signed distance field) stores distance-to-edge instead, which scales better but rounds sharp corners. MSDF adds channels so corners stay crisp, but it is still a baked atlas at a chosen resolution. Slug skips the atlas and computes coverage from the glyph's actual Bezier outline in the shader, so it stays exact at any size or angle.

Why does text go blurry when I scale or tilt it in 3D?

Because most engines draw text from a pre-baked bitmap atlas. Magnify past the baked resolution, tilt it in perspective, or wrap it onto a surface, and you are stretching a fixed grid of pixels, so the edges soften. Outline-based methods like Slug avoid this because coverage is computed per pixel after the transform.

What is the Slug algorithm?

Slug is a technique published by Eric Lengyel in 2017 that renders glyphs directly from their quadratic Bezier outlines on the GPU, with no texture atlas and no per-frame tessellation. A fragment shader casts a ray per pixel and counts curve crossings to get exact coverage, using Lengyel's “root eligibility” test for correctness where curves meet.

Is the Slug technique free to use now?

Yes. Lengyel dedicated the Slug patent to the public domain in March 2026, so anyone can implement the technique. AlphaPixel's Slughorn is a C++20, MIT-licensed implementation of it.

When should I use MSDF instead of Slug?

When you can bake an atlas up front, your text is fairly static, and you want one cheap shader that runs on a wide range of hardware. MSDF is a strong default for game HUDs and app UI. Slug wins when text must stay crisp at any scale and angle, when glyph sets are huge or dynamic, or when the camera relationship is unbounded.

Does Slug handle large glyph sets like Chinese, Japanese, and Korean?

Yes, and without the atlas-memory explosion. Because Slug stores outline data instead of baked bitmaps, tens of thousands of CJK glyphs cost a font's worth of curve data rather than a giant multi-size texture. In Slughorn the per-glyph band structure adds moderate overhead, still well below a CJK atlas.

How is Slughorn related to Slug?

Slug is the algorithm (Lengyel's); Slughorn is AlphaPixel's library that implements it. Slughorn feeds any GPU API (OpenGL, Vulkan, WebGPU, Direct3D) and draws any filled and stroked vector geometry, not just text.

The Daily Front Page 14 of 31
Wednesday, September 30, 2026 The Daily Front No. #260930 — The Cortex in Motion
article

Surprisingly complex waves reveal the brain's inner workings

by ibobev·▲ 142 points·49 comments·quantamagazine.org ↗
Unexpected patterns traveling across the cortex may be reorganizing its activity in real time.

Unexpected patterns traveling across the cortex may be reorganizing its activity in real time.

Mark Belan/Quanta Magazine

I get out of bed. I walk through the dimly lit hallway, thinking of what’s in my fridge and what I should have for breakfast. With no real effort, I’ve navigated my environment, accessed my memory, and assessed the energetic state of my body, all in the space of a few seconds. How is the brain able to do this?

Partly by harnessing electricity. The brain spends about half of its energetic resources maintaining the electrochemical gradients that keep neurons poised and ready to fire at a moment’s notice. This gives the brain an extraordinary level of flexibility in responding to the demands of everyday life. The collective electrical activity of many neurons can be seen as waves propagating through the brain from one region to the next, like the raised arms of enthusiastic spectators at a football game.

New lines of research are revealing that these waves are more complex than previously known. Typically measured by electrodes, they have been identified as basic planar waves: simply structured oscillations in neural activity. Neuroscientists have traditionally interpreted this as a bit like the sound of the brain’s engine revving, little more than a sign that it’s working. However, emerging evidence in humans and animals suggests that traveling waves play a central role in how the brain functions.

“The work coming out is moving this from ‘Are they relevant?’ to ‘This is a major motif of how the cortex processes information,’” said Earl K. Miller, a cognitive neuroscientist at the Massachusetts Institute of Technology.

In a study published in April 2026 in Nature Communications, neuroscientists measured traveling waves of neural activity and observed a menagerie: source waves that appear to emanate from one location, sink waves that converge on a spot, and vortexlike spiral waves. The team, which included Joshua Jacobs and Anup Das from the University of Chicago, found that different behavioral tasks were associated with distinct wave patterns.

Joshua Jacobs and Anup Das were part of a team that observed complex patterns of brain waves using intracranial electrodes.

Courtesy of Joshua Jacobs

Neurons can change connections with their neighbors over time, but this usually happens on the scale of days or months. Behavior, however, needs to adapt in seconds. A significant number of neuroscientists now believe these large-scale wave patterns may help to reorganize the brain in real time to meet the behavioral demands of waking life.

“Even if the traveling wave was just the result of neurons firing, like the sound of the engine, it still tells us something very interesting about the brain based on what the person is doing,” Jacobs said. “If you see a sound moving in a direction across your engine, it means something in your engine is directionally organized.”

Back and Forth

As far back as the 1920s, neuroscientists have been measuring the brain’s oscillating electrical activity with electrodes on the surface of the scalp via electroencephalography (EEG). When we pay attention, remember, or sleep, the large-scale frequency of the brain’s electrical activity changes. These various oscillations are commonly known as alpha, beta, gamma, and theta waves, and are measured in hertz.

But recording electrical activity from outside the skull limits the fidelity of the information you can gather. Jacobs’ lab specializes in intracranial brain recordings. People with severe epilepsy may have had electrodes placed inside their brain to help locate the source of their seizures. With roughly 100 electrodes placed in a particular brain region, and with permission from the patient, Jacobs and his team are able to capture high-resolution data — across both space and time — as the participants perform various thinking tasks.

Neuroengineer Uma Mohan observed waves traveling across the brain during memory tasks, which could help it switch between functions quickly.

Courtesy of Uma Mohan

Jacobs and his collaborator Uma Mohan, who is now a neuroengineer at the National Institutes of Health, were part of a team that used this technique to observe brain activity during memory tasks. In a study published in Nature Human Behavior in 2024, they described waves moving in opposite directions across the brain’s outermost region, the cortex. “They either go back to front or front to back across the brain,” Jacobs said.

Jacobs said a good way to understand this result is to think of the waves as showing the direction of information propagation. Visual regions are in the back, and the prefrontal cortex, the “higher-level” memory region, is at the front. If you’re paying attention to what you are looking at, signals are traveling backward from receptors in your eyes to the visual cortex, and then forward into the rest of the brain via the wave to form a memory. “The signature of that is to see waves going from the back of the brain to the front,” Jacobs said.

“We thought that was a way the brain was exploiting this organization to switch between encoding and recall memory functions on a rapid timescale, depending on what you need your brain to be supporting,” Mohan explained.

Shifting Patterns

The 2026 research from Jacobs and Das complicated this picture. It showed that these waves can take on much more diverse shapes, patterns, and ripples, far beyond those created by simple up-and-down and back-to-front movement.

We thought that was a way the brain was exploiting this organization to switch between encoding and recall memory functions on a rapid timescale, depending on what you need your brain to be supporting.

— Uma Mohan, National Institutes of Health

In the experiment, the team asked participants to perform two memory tasks. The first was a simple verbal memory exercise, in which they had to recall words they had seen on a screen. The second was a more complex spatial task: They navigated a virtual environment and had to recall the locations of objects they encountered.

With the high-resolution method, Jacobs and Das observed two new classes of waves in awake humans for the first time. One, emanating from an area of the cortex, was a concentric wave, like the ripples from a pebble dropped into a lake, or the reverse, in which waves converged on one region. The other was a rotating spiral wave traveling in a clockwise or counterclockwise direction, like a hurricane or a flushing toilet.

“We see the rotating wave in the spatial task a little bit more often than the waves we see in the verbal task, which tend to have a simpler structure,” Jacobs said. “This seems to suggest these rotating waves are better for performing more complex memory behaviors.”

Researchers have been making intracranial recordings in humans for a long time, Jacobs said, but they often only looked at one electrode at a time, or a handful. This gave an impression of simple waves across the whole outer cortex. Jacobs realized that, if you look at groups of electrodes that are separated by the right distances, the structure and directionality of the waves becomes clearer.

Mathematical biologist Bard Ermentrout thinks that simple wave patterns seen in past experiments might have been part of more complex waves.

Courtesy of Bard Ermentrout

Jacobs got in touch with Bard Ermentrout, a mathematical biologist at the University of Pittsburgh who had been looking at similar patterns in mice. Ermentrout thinks the simple wave patterns observed in the past might actually have been part of more complex waves. However, until recently, researchers haven’t had access to electrodes placed in the right locations or at the right spatial scale to catch the larger pattern.

“Maybe the planar waves are just the outer arms, where you’re missing the eye of the storm,” Ermentrout, a co-author of the April 2026 paper, said. “In a hurricane you only feel the wind going in one direction. You don’t know that it is spinning unless you’re right there by the eye.”

Because the research only collects data from locations where the patients have had electrodes placed as part of their epilepsy treatment, “we might be missing how ubiquitous these patterns really are,” Jacobs said.

More Than the Motor

Although there is no consensus yet about what these waves in the brain’s local electric field may be doing, some scientists believe they provide another avenue for the brain to coordinate activity between regions. Miller said that these wave patterns are much more dynamic and flexible than the stable, more architectural connections between neurons. For Miller, it makes sense that the brain would exploit this emergent, biophysical layer of organization that shifts and moves on the same timescale as behavior.

“The architecture of the brain is really important, and the traveling waves tend to follow the anatomy, but they don’t strictly follow it. … The connectivity is more like the information that’s baked into the brain for long-term storage, and the waves are when that information gets expressed in terms of thought and neural processing,” Miller said.

The waves might be relevant to a variety of brain functions. Studies have found evidence that they play a role in sensory processing, prediction, and modulating the underlying excitability of neurons, making them more or less likely to fire when called upon.

Zhiwen Ye, a neuroscientist at  Shenzhen Medical Academy of Research and Translation, and his colleagues observed rotating waves that were mirrored across the left and right hemispheres of mouse brains.

Pei Zhao

A paper published in Science in June 2026 echoes the results found in human epilepsy patients by Jacobs and his team. The neuroscientists Zhiwen Ye of Shenzhen Medical Academy of Research and Translation and Nicholas Steinmetz of the University of Washington also observed circular, rotating waves, but this time in the brains of mice. Fascinatingly, these waves were mirrored and synchronized between the left and right hemispheres. What’s more, in the somatosensory cortex — where information from the senses is integrated with bodily movements — axonal neurons were wired together in a spiraling, circular arrangement. That might facilitate the production of these hurricane-like waves.

“What we found was there is a circuit, a connection of cells to form these waves, to mediate these waves,” Ye said. “If they are not important, why would the brain try to wire these cells in this way?”

In a review paper published in September 2026 in Neuron, lead authors Lyle Muller of the University of Texas at Dallas and John Reynolds of the Salk Institute for Biological Studies drew on decades of neuroscientific findings to make the case that traveling waves in the visual cortex could help with predicting upcoming sensory information. They described how evolving patterns can carry information about what the brain has just experienced alongside what it is experiencing now to help the brain make short-term predictions about what it is likely to experience next.

The waves in the local electric field may play a key role in cognition, Miller said, with the ability to excite or inhibit the underlying neural machinery. He describes neurons in the cortex as “Humpty Dumpty sitting on a wall,” teetering right on the edge of firing. This oscillating electrical activity can alter the voltage gradient at the synapses that connect neurons, making them more or less likely to fire in the future.

Not everyone buys the hypothesis that traveling waves in the local electric field play a role in how the brain processes information. For György Buzsáki, a systems neuroscientist at New York University, waves are merely a reflection of what’s going on underneath, at the synaptic level. The more neurons you have, and the more synchronous they are, the stronger the electrical field and the oscillations in it will be. The patterns can tell us interesting things about the circuitry underneath, but that’s about it, according to Buzsáki. “The current that is being generated is done by synapses,” he said. “When current goes into the neuron, they do their computation and generate their action potentials and communicate with each other. You don’t need anything happening in the extracellular space.”

Although the true nature of what, if anything, these waves are doing is not fully settled, evidence is mounting that they may be important to how the brain organizes, processes, and expresses information in real time.

“Biology exploits regularity and predictability, and these waves are doing organized, predictable things in association with cognitive functions,” Miller said. “If that doesn’t tell you something is going on, I don’t know what does.”

The Daily Front Page 15 of 31
Wednesday, September 30, 2026 The Daily Front No. #260930 — MicroVM at the Edge
article

5x faster Edge Functions: V8 isolates to Firecracker MicroVMs

by jbott·▲ 137 points·53 comments·netlify.com ↗
About a billion Edge Functions run on Netlify every day.

Netlify Edge Functions powered by Firecracker MicroVMs

About a billion Edge Functions run on Netlify every day — Sunweb personalizing pages, Loto-Québec routing traffic on a cookie check, and hundreds of thousands of other sites doing everything from personalization to routing to auth. All of it runs on a full JavaScript runtime that scales with our customers’ traffic.

This poses a significant technical challenge, as we strive to make the latency as low as possible. To run tens, sometimes hundreds of thousands, of edge functions per second, we need to process each request, route it correctly, allocate compute capacity, and boot both our platform code and the customer’s code. All of that has to happen within milliseconds.

Over the past several months, our team has rebuilt the infrastructure behind Edge Functions, working closely with the team at Unikraft, who wrote about the experience from their side. In the past, requests went out to a hosted execution service. Today, they run on MicroVMs inside our own edge network — roughly 5x faster at the median. That shift also improves security and reliability, and opens up more possibilities for running complex compute at the edge.

This doesn’t change how Edge Functions are written or used — URL imports, npm packages, Node built-ins, netlify.toml declarations, local development — all of it works exactly as it did before. It’s now faster and more resilient. In this article we’d like to share more about the new architecture and our learnings on building a new compute platform that’s able to serve high volume at a low performance overhead.

The numbers, first

An edge function runs in front of a site, on every request that matches it. The time it takes is time a customer spends waiting, so milliseconds here count for more than they do almost anywhere else.

A warm invocation — routing to a compute node, entering a MicroVM, running the function, producing response headers — now costs:

  • ~5–6ms at median (p50), down from 25–40ms on our previous infrastructure
  • 47.4% faster p99 invocations
  • 99.998% availability
  • 5x faster edge function log delivery

Median warm-invocation latency decreased from 25–40 milliseconds with V8 isolates to 5–6 milliseconds with Firecracker MicroVMs

A cold invocation is worth stating too. When a request arrives in a region that no compute node has seen before, it needs to fetch the relevant images before it’s able to run anything. This happens on about 1.2% of invocations and takes about 9ms on average.

What happens during request time

What follows is the path a single request takes, in order: it arrives at the edge node, it’s turned into a specification, is routed to a compute node, and then handed off to a MicroVM that may or may not already exist based on whether it’s a cold or warm invocation.

Warm and cold Edge Function requests traveling from the client through an edge node and compute node to a MicroVM instance

Request arrives at the edge node

Every request lands on the Netlify edge node closest to the client. The node terminates the TLS connection and checks the request path against the Edge Functions’ routes for that deploy.

If nothing matches, the request carries on to the cache and onto the origin as usual. If a route does match, this is the point where the request used to leave our network. With our old infrastructure it went out over the internet, ran the edge function, and came back to us to pass on. With the new compute platform, the request is forwarded to a compute node within our network.

An edge node matching an Edge Function route before forwarding the request to a compute node

Creating an Edge Function service

When the compute node receives the request with the machine specification and the service ID, it first checks to see if a service with that ID already exists. If it does, it forwards the request into the service for it to send into the MicroVM. A service lets us have multiple MicroVMs associated with the same site’s Edge Functions, and allows us to configure parameters for when to scale MicroVMs in and out. For example, we configure each service to only allow a fixed number of requests to be handled by a MicroVM before we shut it down, to avoid MicroVMs running indefinitely. We use the same parameters to know when to eagerly boot up another MicroVM in anticipation of one shutting down.

If a service for the site’s edge functions doesn’t already exist on the compute node, one is created, and we check to see if we have all the images in the machine specification on disk. If any are missing, they’re fetched from the edge node and written to disk. This approach means we only fetch the edge function images that are receiving traffic in that region.

The edge node writes a spec

Before the request goes anywhere, the edge node writes a specification for the machine that will run a function. The spec names three images: the runtime, our platform image, and the edge function image. It also sets the CPU, memory, and connection limits.

The spec travels with the request, on every request. Its hash and site-specific information is computed to become a service ID. This allows for isolation, since two deploys with different code or different environment variables are different services, and they never share a MicroVM.

This isolation matters most for failures we don’t want to be possible. A potentially compromised deploy runs in a separate MicroVM, and even if it escapes the runtime, it cannot poison other customers or the compute layer itself. V8 isolates, no matter their name, do not provide this level of isolation.

Choosing a compute node to run an edge function

Each region has a group of compute nodes. The edge node picks one for the service using rendezvous hashing: the same service lands on the same node every time, which is what keeps a MicroVM warm and the code already on disk and in cache once it’s been read. This stickiness gives us a caching strategy. If we spread requests evenly across the swarm, we’d end up with a higher level of cold starts.

It’s important to remember that while sending every request for a function to the same compute node is the fast path, it’s also how a hot spot forms — where one busy function competes for resources with everything else on that box. A service taking a large share of a region’s traffic pinned to a single node will saturate the node at the expense of other services that hashed to the same node.

We balance this by relaxing the stickiness. Over a certain threshold, we spread the service across a slice of nodes. This lets us absorb sudden spikes in traffic from a single customer without affecting other services that hashed to the same node.

Finally, once a node is chosen, it pulls in the function’s code. A compute node that has served the function before already has it. A node seeing it for the first time fetches it once and caches it, so only the first request pays that cost.

An edge node selecting a compute node where Edge Function images are pulled and cached

Starting the MicroVM

Each function runs in its own Firecracker MicroVM. These are created in under a millisecond and start in about 2ms at p99, because the VM starts a stripped-down Linux environment rather than a full operating system. The edge function’s files are mounted as an uncompressed EROFS image and then memory-mapped, so the VM reads only the parts of the bundle it actually uses instead of loading all of it.

When the MicroVM boots up and the JavaScript server begins to listen on a port, we take a snapshot of the MicroVM. When the edge function isn’t being invoked, the MicroVMs running it scale to zero instead of sitting idle. The next time it’s invoked, we start a new MicroVM from that snapshot. The snapshot is memory-mapped, so the VM can start executing without waiting for the entire snapshot to be read back into memory.

The lifecycle of the VM — boot, snapshot, restore, and scale to zero — is the work of Unikraft’s product. We worked closely with them throughout the migration to make sure it holds up under our request volume and traffic patterns.

Running and response handling

After operating this project for several years, we already had learnings we incorporated to maximize performance and the ability to debug. At scale, we’ve run into all kinds of issues, from running out of ports on virtual switches to DNS (we were surprised, but it wasn’t always DNS).

In this iteration, we made sure compute nodes run local DNS resolvers. We’ve also expanded the metrics we collect, recording things like boot time, time to first port open, and time to start user code. There are also several circuit breakers in place to ensure prompt rerouting and decommissioning of compute nodes.

Circuit breakers monitoring the Edge Function request path and MicroVM instances

That’s the whole path, and on a warm instance it adds about 6ms. None of it leaves our network, and we’re in control of the whole request cycle. Everything above happens between the request arriving and the response going back out.

Designing resilient compute infrastructure

When you build a system like the one described above, you’re optimizing for two things at once: the end-user experience and rollout resiliency. We need to be able to roll out changes quickly but balance that with the ability to roll back just as quickly.

The compute nodes are built from a base image published by Unikraft and install a set of packages. These nodes are built separately from our edge nodes for a couple of reasons: it keeps our edge nodes lightweight and fast, it lets us use different instance types for our compute nodes, and it lets us scale these nodes independently.

A control plane keeps track of which compute nodes exist and which are healthy, and the edge nodes poll it for that list. It’s also what drives a deploy — a new fleet comes up alongside the running one, scales to match it, and takes over traffic only once it’s healthy.

Building the compute infrastructure has required close collaboration with the Unikraft team. Throughout the migration, we’ve worked with them on testing correctness, handling large volumes of requests, and building capabilities specific to our platform.

It’s live

The work to rebuild our edge compute architecture is more than just a speed boost. It’s a faster foundation we can keep building on and have more control over. The best part is that it’s already serving your production traffic today, at the same pricing, with no migration step and nothing to change in any project.

Running the compute ourselves means the ceiling on Edge Functions is ours to raise. Three things this makes tractable that weren’t before:

  • npm package support, out of beta. npm packages work in edge functions today, in beta, with caveats around native binaries and importing files at runtime. A real VM with a real filesystem removes most of the reasons those caveats exist.
  • Room to revisit the operation limits. The documented limits of 50ms of CPU per request, 512MB of memory, and 20MB of compressed code came from the isolate-based execution model.
  • Compute inside our own network. Anything that depends on controlling the network path, instead of reaching a third party across the internet, is now something we can build.

We’re not done here. The limits and rough edges we couldn’t touch before are the ones we’re working on now, so stay tuned.

The Daily Front Page 16 of 31
Wednesday, September 30, 2026 The Daily Front No. #260930 — The Classroom and the Model
article

CS240 AI Cheating Retrospective

by ArchAndStarch·▲ 102 points·88 comments·turkeyland.net ↗
I found myself at the center of a storm involving use of “AI” in CS 240.

CS 240 Spring 2026 AI Retrospective - September 25, 2026

Academic integrity and AI

Toward the end of the Spring 2026 semester, I found myself at the center of a storm involving use of "AI" in CS 240: Programming in C. My approach to addressing the issue should have been better and is primarily why the individuals that ran afoul of the clearly stated course policy ultimately incurred little to no consequence.

I am writing this post largely due to the number of students that continue to approach me and mention how much misinformation and inaccuracy surrounds the, apparently, ongoing discussions regarding the incident.

Policies and Expectations

To begin, I wish to be abundantly clear: the Spring 2026 offering of CS 240 had a clearly articulated prohibition with regard to using AI/LLMs to solve any assignments in the course. You can find it in the syllabus here. Specifically:

You may discuss assignments in a general way with other students, but you may not consult anyone else's work. Among other ways to get an F, you are guilty of academic dishonesty if:

...
- You utilize ChatGPT or other software to programmatically generate solutions to any part of an assignment, quiz, or exam

Moreover, the syllabus clearly states that we may not immediately address violations of the academic integrity policy:

If we find reason to believe that a student or team has cheated on any assignment, we may inform the student or team promptly, or we may decide to silently accumulate evidence against the student or team on later assignments.

Finally, it was even clearly communicated in lecture that reading and understanding the syllabus was each student's responsibility, as mentioned on the slide from Lecture 1 found below:

Slide on Syllabus

I have been told some people may be implying that the expectations above were somehow a surprise to those enrolled in the course. Such a claim is highly specious. In addition to the syllabus, I went back and checked: this expectation was addressed repeatedly in at least five lectures. I have included some of the slides from those lectures below. Note that while some may not explicitly mention AI, my slides are a starting point for what I discuss in lecture and do not encompass everything that is said. I will add that I am quite certain that I discussed these expectations at other times but without a slide to explicitly reference as well.

Here are the slides from Lecture 1 on January 12, 2026:

Slide on Academic Integrity Slide on Academic Integrity Slide on Academic Integrity Slide on Academic Integrity Slide on Academic Integrity

On January 14, 2026 I discussed the policy again in Lecture 2. While the slide itself does not mention LLMs, I did take the opportunity to mention the policy verbally again. Lecture 3 on January 21 included yet another reminder...

Slide on Academic Integrity

Another discussion occurred in Lecture 7 on February 4, 2026. It was at this time we were beginning to focus on specific identifiers during the development of Argus, the tool that would later be deployed.

Slide on Academic Integrity

So, it was always the case that it was made abundantly clear to students that they should not be using AI/LLMs to complete assignments and that doing so was a violation of the course academic integrity policy.

Moreover, our usage of MOSS to identify cheating incidents proceeded as in semesters prior. Throughout the entire semester, students identified as having highly similar code were confronted and, when appropriate, incurred consequences resulting from their violation of the above policy.

Argus

Another mistaken impression some seem to have formed is that we trained our own LLM to assist with identifying students that violated this policy. We did not. The tool developed - named Argus - utilizes static analysis to identify indicators for which it is highly unlikely a reasonable explanation exists with regard to their presence in a student's source code.

Over the summer, we actually authored a paper regarding this tool. You can find a preprint version of it on arXiv or locally here. The paper was submitted to SIGCSE 2027. Though ultimately not selected for publication, the peer reviews from that process are available here.

As discussed in the paper, we have also run the tool against earlier semesters with very compelling and interesting results. In particular, the indicators that we use are virtually nonexistent prior to 2024 and their presence increases rapidly over the following years.

All data gathered and analyzed point to high accuracy with regard to the H-score generated. I am certain many would like an exhaustive list of the indicators that we identify. But, providing such would almost certainly reduce the utility of the tool. If you are an educator or someone with a legitimate interest in this information, please feel free to contact me (jeff@cs.purdue.edu). I am unopposed to providing it in situations where I know it will be properly protected and used.

It is important to point out that Argus served only as a starting point. Each potential case identified was looked at by at least one person prior to any further action. Not all cases were pursued. In fact, we took a very conservative look at each case, only pursuing ones for which there was clear evidence and a lack of any reasonable explanation for the existence of that evidence. Ultimately we flagged 267 out of 584 identified students (roughly 45.7%).

The Lead Up

Argus reached a usable state around mid-March of 2026. We began discussing it during our weekly TA meetings around that time, and on March 23 I ultimately decided to form an "AI Academic Integrity" (AIAI) team to address the large number of potential AI usage cases. We began efforts in earnest to set up the necessary processes.

Discussions continued after the formation of the AIAI team and, as we considered division of labor and preparation for meeting with hundreds of students, I was reminded of the approach historically taken by CS 159. In this course, instructors would email students identified as having violated course policy and offer them an opportunity to simply admit responsibility. One of these emails from Fall 2017 is included below. During our April 13, 2026 meeting I decided to adopt a similar approach utilizing a form that I would subsequently create with the hope that a self-reporting mechanism would cut down on the number of cases that would require further discussion.

Concerns of potential academic integrity violations have been raised based on your submission for the fifth homework. The solution you submitted has been measured and determined to be highly similar to that of at least one other student in the course.

The work you submit must be your own original effort and not the result of unacceptable, even if unintentional, collaboration. Although it may not be intentional, extensive collaboration with others may result in highly similar work that resembles copying. Every student is also responsible for protecting his/her own work. If you inadvertently allow your work to be accessed, you may still be held responsible for facilitating an academic integrity violation.

Please take a moment to review the policies of the course found in your syllabus related to academic integrity.

In this particular case, the high similarity between your assignment and others was identified by computer software and upon review cannot be dismissed by mere coincidence. As a result you will be assigned a score of zero for the assignment according to the academic integrity policy outlined in the course syllabus. If you are willing to accept these findings, please reply to this email by the stated deadline (see below) containing the following response:

"I acknowledge that my assignment submission is in violation of the academic integrity policy of the course and accept the score of zero for this assignment. I have no intentions of doing this again in the future and realize that a second offense would result in my failing the class."

After the above statement, you must include a short summary of the actions and names of others involved that resulted in this incident. There would then be no further repercussions as a result of this incident and a favorable report will be sent to the Office of the Dean of Students stating that you were cooperative and accepting of the outcome. The case would then be closed as far as this class is concerned, but the Dean of Students reserves the right to discuss this incident with you in the future and take additional disciplinary action if warranted.

If you wish to contest these findings, you must meet with me during office hours on or before Tuesday November 14. Please be aware that denial of the incident and/or fabrication of the events would result in a less favorable summary to the Office of the Dean of Students if you are found to be in violation, and additional penalties could then be applied. Failing to respond to this request will be reported to the Office of the Dean of Students as being non-cooperative.

I hope that this matter can be resolved as pleasantly as possible for all involved. Thank you for your time and prompt attention to this matter.

Based on this email (and my use of similar ones in past offerings of CS 240 as well), I created the form found below. I will also note that this is where my use of the favorable/unfavorable language originated. Although some students also seemed at the time to be hung up on the possibility of suspension or expulsion, that is not something within an instructor's power nor is it something that typically happens for a first time offense. I did not mention either possibility in my communications or on the form, though I believe I briefly mentioned them in lecture as something the Dean of Students could consider.

The Process

On April 16, 2026, I sent out the following email with the subject "[CS 240] Academic Integrity Violation - RESPONSE REQUIRED":

Through careful analysis and manual review, we have identified what we consider to be clear and concrete indicators in one or more of your homework assignment solutions that it was partially or entirely generated by an AI/LLM tool like ChatGPT, Claude, Copilot, etc. This is a violation of the course academic integrity policy stated in the course syllabus and reviewed during the first week of classes.

You are required to complete the form located at:
https://endor.cs.purdue.edu/~cs240ai/index.php
on or before Monday, April 20 at 5:00pm EDT.

Failure to respond will result in a grade of 'F' for the course. Note that even if you intend to drop the course, we require a response. Failure to respond will also result in an unfavorable letter being sent to the Dean of Students along with further potential disciplinary action.

Prof. Turkstra

A screenshot of the linked form is included below:

AI Report Form

CS 240 had a beginning enrollment of 599 students for the Spring 2026 semester. At the time that the email was sent out, 65 students had withdrawn from the course already. The email above was sent to 207 enrolled students in the course. An almost identical email was sent to 60 additional students that had already dropped the course, since letters would still need to be drafted to the Dean of Students. This represents a little under 45% of the students.

It is worth noting that the standard penalty outlined in the syllabus for an academic integrity violation is stated below:

Academic dishonesty is a serious offense which may result in suspension or expulsion from the University. In addition to any other action taken, such as suspension or expulsion, a grade of F will normally be recorded on the transcripts of students found responsible for acts of academic dishonesty.

"grade of F" is bolded in the syllabus. For first time, minor violations on a single assignment, I typically proceed with the lesser penalty of a score of 0 and a course letter grade deduction.

As one can see from the form above, I lessened the penalty further in this situation partly due to the late deployment of the tool. The consequence would simply have been a 0 for each assignment.

The initial response to this process from my end was surprisingly positive. Before the university intervened, 117 students submitted the form. 108 simply took responsibility for their actions. Only 9 disputed the findings. It is an open question whether this is reflective of their actual behavior or instead something that underscores the purported, and unintentional, potentially coercive nature of the form. Ultimately, 144 students submitted enrollment drop requests for the course after this process began.

I met with well over a dozen students the following day. Every single one of them was apologetic. A handful of them even thanked me, sharing with me that they did not truly understand the ramifications of their actions until I had pursued these cases.

The Backlash

Simultaneously and without my knowledge, contact was being made by people - some invariably parents and students - both with our department head as well as the Dean of Students and other units on campus. I am also told there was significant discussion on the Purdue subreddit, though I have yet to subject myself to a gossip mill of such scale.

Eventually some of this stuff made it to me - including direct emails from individuals. Many of the ones that I saw were anonymous, which leaves one wondering whether they even originated from anyone associated with Purdue. Some were angry, some were abusive, but most, surprisingly, offered praise and support.

Of course this was only the beginning. I soon learned that the local newspaper - the Journal and Courier - had picked up the story. Soon after I was contacted by the Purdue Exponent, our campus newspaper as well. It was a chaotic time, and I was instructed to not speak to the press. So, I refrained from doing so initially. I did ultimately speak to a reporter with the Purdue Exponent after it became apparent that there were already recordings and transcripts of the relevant lectures floating around. You can read their article here. To be fully transparent, I will mention that I am on the board of directors for the Purdue Student Publishing Foundation, which publishes The Exponent. This affiliation did not influence the interview or article.

Discussions and Concerns

Meanwhile, things had reached a threshold where our Dean, Dr. Lucy Flesch, had become involved. I met with both her and our Department Head, Dr. Drineas, multiple times over the weekend of 4/18, engaging in fairly involved discussions. Ultimately these distilled down to two primary concerns: that some students may have felt coerced by the timing and format of the form. And, that there could be difficulty ensuring due process given the semester's rapidly approaching end.

Another concern discussed included the fact that the late deployment of Argus removed the opportunity for students to experience lesser consequences resulting from an initial violation and subsequently adjust their behavior. I was less sympathetic to this one, largely due to the clearly articulated course policies combined with the already lesser penalty mentioned above of a 0 for each involved assignment without even a course letter grade deduction or enforcement of the syllabus' stated grade of F.

The due process issue was somewhat less concerning to me as well. Partly because the existing university appeals process was already in place should the resolution at the course level be unsatisfactory. Partly because the students clearly had a mechanism to appeal directly to me before even beginning the sanctioned, university process. Not to mention there have been instances in Purdue's past where academic integrity issues were addressed after the conclusion of a course offering.

The concern that resonated with me the most was the possibility of innocent students feeling coerced. That was never my intention. The timing was, in fact, deliberate, but only because I rushed to get the information out before the university course drop deadline with the goal in mind of keeping that option available for students whose grades would be severely impacted by their actions. In other words, I was trying to give those that would fail a more graceful exit from the course.

In hindsight, I can see how that created a sense of pressure for some - particularly students that may have been incorrectly identified. Having spoken to trusted colleagues, I also see how the format of the form itself could be problematic. Specifically the requirement that they self report on which assignments they used an LLM instead of simply listing the ones that we had identified.

We discussed a number of ways to address the concerns. Ultimately, the decision that was reached was to reverse the retroactive use of the tool on earlier homework submissions. The tool would be used going forward, but any prior incidents identified by Argus would be ignored. Students that had dropped the course would be permitted to re-enroll.

This decision weighed on me, and I actually reached back out on Sunday expressing my concern with the resolution. I suggested again an alternate approach of allowing students to resubmit identified homework assignments, acknowledging that it may have required the assigning a grade of incomplete and resulted in additional work for me over the summer.

We met one final time on Monday morning prior to my first lecture at 9:30am. After further discussion, we settled on sticking to the original resolution.

The Resolution

While all of the above was happening, it was also becoming abundantly clear that a group of people were continuing to stir things up online. I was warned that many individuals not enrolled in the course were intending to show up to the lectures that day in the Class of 50 Lecture Hall. To mitigate this concern, I asked for volunteers from our TAs to ensure that entry was only granted to students enrolled in the course. We also requested that a fire marshal be present to ensure we remained within the capacity constraints for the facility.

I am grateful to the Purdue Fire Department for their presence in the hall during that time. The TAs, as well, did an outstanding job in keeping a chaotic situation under control. They have my sincere gratitude as well.

I want to be clear that our efforts were made solely to ensure people's safety as well as preserve the classroom environment for enrolled students. No attempts were made to control the release of information. In fact, at one point one of the TAs brought to my attention that a student was streaming a recording of the lecture to others outside of the room and asked if they should be told to stop. I unequivocally indicated that it was fine for them to do so in that specific situation.

I started the lecture discussion with the slide below:

Purdue Honor Code

This is the Purdue Honor Code. Each student agrees to adhere to it when they start here at Purdue University.

I spent a substantial amount of course time discussing course policy, the existing MOSS process (which was not impacted), the concerns outlined above, and the ultimate resolution. I also emphasized that I lack the ability to suspend or expel a student and that the Dean of Students typically considers that only when there are prior offenses or egregious behavior like deliberate misrepresentation or lying.

I restated that our goal and approach here was to only consider students that had blatant anomalies for which the only reasonable explanation we could come up with is the usage of an LLM. I even mentioned the well known Benjamin Franklin quote - "it is better 100 guilty Persons should escape than that one innocent Person should suffer." I share this belief and used it to guide our actions throughout the process.

Ultimately, as I mentioned above, we decided to discard the retroactive findings. We did use the tool moving forward for the remaining assignments. Of the 144 students that dropped initially, roughly half (74 students) re-enrolled in the course.

I will mention that I also displayed these two, ad hoc slides generated by one of our head TAs, Ajay Rawat, and discussed the clear difference in performance on both midterm exams for those identified as using an LLM.

Midterm 1 Performance Midterm 2 Performance

For the first midterm exam, the difference was 10.75%. On the second midterm, it was even greater: 14.5%. Better graphs and a more thorough analysis can be found in the Argus paper. There is very strong and compelling evidence across multiple semesters that students that use LLMs while learning to program perform significantly worse on controlled assessments. There are an increasing number of compelling studies like this out there, including the well-known MIT Paper. This is, perhaps unsurprisingly, not limited to programming.

Takeaways

The way in which I addressed these cases should have been better. Primarily, the process that was put in place should have clearly articulated the identified assignments and probably involved meeting with each student individually. Though, again, there is precedent for the meeting being student initiated.

The timing was also unfortunate. Certainly the safest approach would be to ensure deployment of a tool like this only at the beginning of the semester. If that is not possible, retroactively applying it to earlier assignments is something that should be carefully evaluated and only pursued with knowledge and support of other relevant university units.

Regardless, deploying close to the drop deadline is certainly unwise.

If you are one of the innocent students that experienced undue stress because of the pressure created here, I offer you my sincere apology. I am sorry.

I do remain convinced that the vast majority of students identified here cheated. Not because the tool identified them, but because we actually looked at the markers and associated code.

If you are reading this and are one of those students, you have behaved in a way contrary to the Purdue spirit and our Boilermaker values. Moreover, you took an Honor Pledge upon joining the student body at this university, and your actions have clearly violated that pledge.

That said, I have no judgment to pass on you here. We are all human beings, we all make poor choices and mistakes in our lives. I genuinely hope that you learn from this and alter your course, making better decisions in the future. If for no other reason than doing so will make you a better person and a better computer scientist.

The quote from my lecture that the Purdue Exponent ended with in their article is a poignant one: "We have students who have invested a lot of effort, have not cheated, and now get to watch some of your classmates leave with no consequences," Turkstra said. "I don't have an answer to that." Perhaps my biggest regret here is very much that.

I do take solace in a few things, though. First, the data both in our ad-hoc analysis at the time as well as our subsequent paper show clearly that students who cheated have worse grades. Second, while the percentage of students identified was substantial, it was still less than 50%. Most students are engaging in a good-faith effort to learn the material. And, third, this entire situation has, I think and hope, helped our students better understand the detriments of taking shortcuts in learning.

Another takeaway, for me, is the recognition that this process and resolution was made under pressure. In hindsight, I should have worked harder to address the PR concerns on the university's side while ensuring the resolution itself was measured and unhurried.

Argus was deployed for the remainder of the Spring 2026 semester and has been in use in subsequent offerings of CS 240.

The Daily Front Page 17 of 31
Wednesday, September 30, 2026 The Daily Front No. #260930 — Argon, Rated
article

Gemini 4 Argon (High): Intelligence, Performance and Price Analysis

by theanonymousone·▲ 96 points·49 comments·artificialanalysis.ai ↗
Gemini 4 Argon (High) is amongst the leading models in intelligence and reasonably priced.

Model summary

Intelligence

#8 / 223

53

Artificial Analysis Intelligence Index

4 out of 4 units for Intelligence.

Speed

N/A

Output tokens per second

Unknown out of 4 units for Speed.

Cost

#77 / 223

In $2.00
Out $10.00
Cache Discount 95%

$1.99

Cost per Intelligence Index task

3 out of 4 units for Cost.

Verbosity

#74 / 223

110M

Output tokens from Intelligence Index

3 out of 4 units for Verbosity.

Comparison Summary

Gemini 4 Argon (High) is amongst the leading models in intelligence and reasonably priced when comparing to other models of similar price. The model supports text and image input, outputs text, and has a 1M tokens context window.

Gemini 4 Argon (High) scores 53 on the Artificial Analysis Intelligence Index, placing it well above average among comparable models (median: 26). When evaluating the Intelligence Index, it generated 110M tokens, which is somewhat verbose in comparison to the median of 82M.

Pricing for Gemini 4 Argon (High) is $2.00 per 1M input tokens (moderately priced, median: $2.00) and $10.00 per 1M output tokens (moderately priced, median: $10.00). On average, it costs $1.99 per task to evaluate Gemini 4 Argon (High) on the Intelligence Index.

Technical specifications

Reasoning

Yes

This page shows the reasoning version of this model.

A non-reasoning variant may also exist.

Input modality

Supports: text and image

Output modality

Supports: text

Context window

1M

~1500 A4 pages of size 12 Arial font

223 models in this class

Metrics are compared against models of the same class:

  • Non-reasoning models → compared only with other non-reasoning models
  • Reasoning models → compared across both reasoning and non-reasoning
  • Open weights models → compared only with other open weights models of the same size class:
    • Tiny: ≤4B parameters
    • Small: 4B–40B parameters
    • Medium: 40B–150B parameters
    • Large: >150B parameters
  • Proprietary models → compared across proprietary and open weights models of the same price range, using a blended 3:1 input/output price ratio:
    • <$0.15 per 1M tokens
    • $0.15–$1 per 1M tokens
    • $1 per 1M tokens

Highlights

Intelligence

Artificial Analysis Intelligence Index · Higher is better

Not publicly available

Speed

Output tokens per second · Higher is better

Cost per Task

Weighted average cost (USD) per Intelligence Index task · Lower is better

Not publicly available

Intelligence

Artificial Analysis Intelligence Index

Artificial Analysis Intelligence Index v4.3.2 incorporates 10 evaluations: AA-Briefcase v1.1, GDPval-AA v2.1, AutomationBench-AA, Terminal-Bench 4.0, SciCode, Humanity's Last Exam, GDP.pdf, CritPt, AA-Omniscience, AA-LCR v1.1

Not publicly available

Artificial Analysis Intelligence Index

Artificial Analysis Intelligence Index v4.3.2 includes: AA-Briefcase v1.1, GDPval-AA v2.1, AutomationBench-AA, Terminal-Bench 4.0, SciCode, Humanity's Last Exam, GDP.pdf, CritPt, AA-Omniscience, AA-LCR v1.1. See Intelligence Index methodology for further details, including a breakdown of each evaluation and how we run them.

Open Weights

Indicates whether the model weights are available. Models are labelled as “Commercial Use Restricted” if commercial use is limited by conditions, and as “Non-commercial” if the license prohibits commercial use.

Capability Indexes

Measures the performance of models on specific capabilities and industries.

Artificial Analysis Finance & Accounting Index

Incorporates 7 evaluations: AA-Omniscience, GDPval-AA v2.1, AA-Briefcase v1.1, Humanity's Last Exam, AutomationBench-AA, AA-LCR v1.1, GDP.pdf · Higher is better

Not publicly available

Benchmarks

Intelligence Evaluations

Intelligence evaluations measured independently by Artificial Analysis · Higher is better

Intelligence Evaluation Relevance

While model intelligence generally translates across use cases, specific evaluations may be more relevant for certain use cases.

Artificial Analysis Intelligence Index

Artificial Analysis Intelligence Index v4.3.2 includes: AA-Briefcase v1.1, GDPval-AA v2.1, AutomationBench-AA, Terminal-Bench 4.0, SciCode, Humanity's Last Exam, GDP.pdf, CritPt, AA-Omniscience, AA-LCR v1.1. See Intelligence Index methodology for further details, including a breakdown of each evaluation and how we run them.

AA-Briefcase v1.1

AA-Briefcase Elo

AA-Briefcase v1.1 is an agentic knowledge work benchmark developed by Artificial Analysis. AA-Briefcase Elo is a combined metric that aggregates rubric pass rate, analytical quality Elo and presentation Elo · Higher is better.

AA-Briefcase Elo

AA-Briefcase Elo is a combined metric that aggregates analytical quality Elo, presentation Elo, and rubric pass rate, with rubric performance converted into Elo via synthetic head-to-head matches. Elo and 95% confidence interval bounds are clamped at 0.

AA-Omniscience

AA-Omniscience Index

AA-Omniscience Index (higher is better) measures knowledge reliability and hallucination. It rewards correct answers, penalizes hallucinations, and has no penalty for refusing to answer. Scores range from -100 to 100, where 0 means as many correct as incorrect answers, and negative scores mean more incorrect than correct.

Intelligence Index Comparisons

Cost per Intelligence Index Task

Weighted average cost per Intelligence Index task. Each evaluation’s cost is calculated from input, cache hit, cache write, reasoning, and answer token prices, divided by task count, and weighted by its Intelligence Index weight.

Token Use

Output Tokens per Intelligence Index Task

Weighted average number of output tokens used to run one task in the Artificial Analysis Intelligence Index.

The number of tokens required per Intelligence Index task. This is calculated by multiplying the output tokens per eval by the relative weights of each benchmark in the Intelligence Index, then dividing by task count (excluding repeats).

Cost

Cost per Intelligence Index Task

Weighted average cost (USD) per Intelligence Index task, segmented by token type. Lower is better.

Weighted average cost per Intelligence Index task. Each evaluation’s cost is calculated from input, cache hit, cache write, reasoning, and answer token prices, divided by task count, and weighted by its Intelligence Index weight.

Cost to Run Artificial Analysis Intelligence Index

The cost to run the evaluations in the Artificial Analysis Intelligence Index, calculated using the model's input, cache hit, cache write, reasoning, and answer token prices and the number of tokens used across evaluations (excluding repeats).

Cache Hit

Price per token for cached prompts (previously processed), typically offering a significant discount compared to regular input price, represented as USD per million tokens. The values shown here are the cache hit price; cache write and cache storage are billed separately and vary by provider.

Context Window

Context Window for RAG

Larger context windows are relevant to RAG (Retrieval Augmented Generation) LLM workflows which typically involve reasoning and information retrieval of large amounts of data.

Context Window

Maximum number of combined input & output tokens. Output tokens commonly have a significantly lower limit (varied by model).

Frequently Asked Questions

When was Gemini 4 Argon (High) released?

Gemini 4 Argon (High) was released on September 30, 2026.

Who created Gemini 4 Argon (High)?

Gemini 4 Argon (High) was created by Google.

How intelligent is Gemini 4 Argon (High)?

Gemini 4 Argon (High) scores 53 on the Artificial Analysis Intelligence Index, placing it well above average among other reasoning models in a similar price tier (median: 26).

How much does Gemini 4 Argon (High) cost?

Gemini 4 Argon (High) costs $2.00 per 1M input tokens (better than average, median: $2.00) and $10.00 per 1M output tokens (better than average, median: $10.00), based on Google's API.

What is Gemini 4 Argon (High) API pricing?

Gemini 4 Argon (High) costs $2.00 per 1M input tokens and $10.00 per 1M output tokens (based on Google's API). For a blended rate (7:2:1 cache hit/input/output ratio), this is $1.47 per 1M tokens. Pricing may vary by provider. Compare provider pricing

How verbose is Gemini 4 Argon (High)?

When evaluated on the Intelligence Index, Gemini 4 Argon (High) generated 110M output tokens, which is somewhat higher than average compared to other reasoning models in a similar price tier (median: 82M).

Is Gemini 4 Argon (High) a reasoning model?

Yes, Gemini 4 Argon (High) is a reasoning model. It uses extended thinking or chain-of-thought reasoning to work through complex problems before providing an answer.

What input modalities does Gemini 4 Argon (High) support?

Gemini 4 Argon (High) supports text and image input.

What output modalities does Gemini 4 Argon (High) support?

Gemini 4 Argon (High) supports text output.

Can Gemini 4 Argon (High) process images?

Yes, Gemini 4 Argon (High) supports image input and can analyze, describe, and answer questions about images.

Is Gemini 4 Argon (High) multimodal?

Yes, Gemini 4 Argon (High) is multimodal. It can process text and image input and generate text output.

What is the context window of Gemini 4 Argon (High)?

Gemini 4 Argon (High) has a context window of 1.0M tokens. This determines how much text and conversation history the model can process in a single request.

Is Gemini 4 Argon (High) open source?

No, Gemini 4 Argon (High) is proprietary. The model weights are not publicly available.

How many parameters does Gemini 4 Argon (High) have?

Gemini 4 Argon (High) is a proprietary model and Google has not disclosed the model size or parameter count.

How does Gemini 4 Argon (High) perform on benchmarks?

Gemini 4 Argon (High) achieves a score of 53 on the Artificial Analysis Intelligence Index. This composite benchmark evaluates models across reasoning, knowledge, mathematics, and coding.

Is Gemini 4 Argon (High) available via API?

Yes, Gemini 4 Argon (High) is available via API through 1 provider. Compare API providers

Where can I use Gemini 4 Argon (High)?

Gemini 4 Argon (High) is available through 1 API provider. Compare providers

The Daily Front Page 18 of 31
Wednesday, September 30, 2026 The Daily Front No. #260930 — Distance-Field Workshop
article

Halfspace experimental IDE for solid modeling with distance fields

by luu·▲ 91 points·9 comments·mattkeeter.com ↗
Halfspace is an experimental IDE for solid modeling with distance fields.

Introduction

Halfspace is an experimental IDE for solid modeling with distance fields.

Picture of an IDE showing a model for a cabin

Try the demo

(The demo is best experienced on a computer; mobile Safari has some WebGPU issues, and pan / tilt / zoom interactions are not yet designed for multitouch)

Halfspace is a showcase app for the Fidget kernel, which is used for rasterization and meshing. Within the GUI, images are rasterized in real(ish)-time; models can be exported as either images or triangle meshes:

Diagram showing Halfspace and Fidget integration

Since it's 2026, let me note at the outset that this is not vibe-coded. I've been working on it since April 2025 and am writing the code using my human brain, for various reasons (and Fidget dates back to 2022).

Now, the rest of this writeup assumes some knowledge of implicit surfaces; please see many previous writeups for details for more background info (or just keep reading, you'll be fine).

Why?

I've spent a bunch of time writing implicit kernels, slightly less time writing GUIs on those kernels, and even less time actually modeling with those tools.

In practice, I don't actually need to do much solid modeling in my daily life, so most of the stuff that I create is a demo or an example of how to use a particular kernel.

Still, I've noticed a particular tension when working with implicit surfaces. Working with low-level implicit surfaces is a bit like writing assembly: it's low-level, powerful, and annoying. If all you're given is x, y, z variables – and it's your responsibility to combine them into all the shapes of your dreams – that can be a painful experience.

When faced with the pain of writing assembly, most people build abstractions on top of it: high-level languages and libraries that compile down to a low-level representation. The equivalent here is a standard library of shapes and transformations: sphere, box, translate, scale, etc.

Screenshot of a help box listing shapes

There's also a less common approach to the pain of assembly: making assembly itself less painful to write.

My favorite project along those lines is Kartik Agaram's Mu, which wraps emulation, tracing, and time-travel debugging around a subset of x86 assembly language.

Halfspace takes both paths. It includes a (small but growing) standard library, but also makes it easy to build up models incrementally: a complex model can be split into smaller pieces, which can be parameterized and visualized individually.

Model of a Menger sponge

Given that justification, let's unpack the description a bit farther.

Solid modeling

First off, "solid modeling" means that we're focusing on objects with a definitive inside and outside; you should be able to pick any point in space and say whether it's inside or outside the model.

This seems obvious, but there's plenty of modeling that doesn't care about that property: pull up any video game model viewer and you'll see plenty of infinitely-thin textured walls, built from a single fan of triangles. Since my background is in CAD/CAM software (with an emphasis on 3D printing), I want models that can be physically realized.

Photograph of a 3D printed Menger sponge

There are a bunch of ways to do solid modeling. In most CAD software, a boundary-representation geometry kernel is responsible for stitching a bunch of individual surfaces together into a solid body. This is a tremendously hard problem – for example, the intersection of two NURBS surfaces may not have a closed-form solution!

Dating back to my Master's thesis, I've been working on geometry kernels based on implicit surfaces. These have the advantage that they can conceivably be written and fully understood by a single person or small team, so they're a good fit for personal-scale fabrication software.

This continues in Halfspace: it's a GUI wrapped around the Fidget geometry kernel. Models can be designed using some combination of pre-defined primitives and hand-written scripts, and exported as either images or triangle meshes.

An IDE for distance fields

We could use the Fidget kernel purely at the constructive solid geometry (CSG) layer, building shapes (spheres, cubes, cylinders, etc) and combining them with logical operations (union, intersection, difference). Halfspace instead make the decision to put the underlying distance fields in the foreground.

Let me give you an example of why this matters. Here are two distance fields for a sawtooth wave, which have the same signs at every point in space, but different values:

Sawtooth distance field with discontinuities Sawtooth distance field with no discontinuities

In this visualization, the sign (which defines inside versus outside) is shown by color (blue versus orange), with the boundary of the shape shown in white (corresponding to a value of 0). The field values are shown by the fainter lines, which are spaced at regular intervals (like a topographic map).

Despite having identical signs everywhere, the first field is very poorly behaved. Look at the vertical edge of the sawtooth: there's a transition from inside (blue) to outside (orange) without a crossing through zero.

This is a C0 or "jump" discontinuity, and it's bad news! Fidget uses automatic differentiation to compute normals, so the normals across this boundary don't point in the correct direction (compare the field lines between top and bottom images). In 3D, where we use normals for shading, this produces incorrect shading in the cabin's shingles:

Rendering of a cabin with incorrectly shaded shingles

(If this looks familiar, it's because it's extracted from an earlier blog post)

Putting distance fields front-and-center makes it easy to diagnose these kind of issues. In fact, it suggests a further improvement on the sawtooth field: we can tweak the gradient so that it's 1 everywhere, instead of being bunched up on the diagonals. Here's a before / after comparison:

Sawtooth distance field with no discontinuities Sawtooth distance field with no discontinuities and constant gradient

Having uniform gradients makes various algorithms better-behaved; Fidget doesn't require it for correctness, but it may (for example) improve mesh quality.

Halfspace is experimental and cross-platform

Right now, it would be a very bold decision to use Halfspace in any load-bearing capacity. In the Fidget writeup, here's one of the project goals:

Finding the "right" APIs for implicit kernels, with the possibility of making substantial compatibility breaks

Halfspace is similar; it doesn't present APIs to end-users, but I'm flexing my software architecture skills by building a substantial cross-platform application, and I'm willing to aggresively iterate and break things as we go.

Speaking of cross-platform, I'm making my life harder by targeting both the web and native platforms. In the era of supply-chain attacks, being able to share a web link – instead of asking someone to compile and run your code – is great for onboarding and casual usage.

To that end, I've been collecting the "Halfspace stack": a set of libraries and patterns which let me ship a combined native + web application with a minimum of pain. Right now, here are the core pieces:

  • Rust for the application (and all dependencies)

  • egui for the GUI

    • egui_dock for the core window-and-tab abstraction
  • wgpu for both rendering the UI and GPU compute (!)

  • Rhai for scripting

  • Rayon and wasm-bindgen-rayon, used for two purposes:

    • Speeding up parallel algorithms by distributing work over many workers; this is a "typical" usage of the library
    • A thread pool for short-lived background tasks; this is a more unusual usage, but we can't spawn threads on the web.
  • ...and a long tail of other libraries and shenanigans

This all deserves a dedicated writeup, and I have complaints about every single layer of the stack, but overall, it's incredible that everything Just Works™.

Driving Fidget improvements

Another goal of Halfspace is to drive improvements in the Fidget kernel, by using it in a non-trivial application.

The biggest victory on this front has been ongoing work on fidget-wgpu. This was motivated by performance on the web: the native build was pleasantly fast, but doing rasterization on the CPU was awfully slow ("non-interactive speeds") when running through a layer of WebAssembly.

After a lot of work on the Fidget side, both rasterization and post-processing (e.g. shading) can be run purely on the GPU, without any roundtrips to the CPU.

WGPU pipeline

This was both a performance and architectural win:

  • We now have native rendering speed on both native and web targets

  • Rendering logic is no longer spread between Fidget (on the CPU) and Halfspace (with a mix of CPU and GPU code):

    • Fidget implements the canonical rendering logic
    • Halfspace has thin shaders which draw an RGBA texture

(The 2D rendering pipeline is also now fully GPU-accelerated, although it has slightly fancier shaders in Halfspace, for reasons)

Wrapping up

Halfspace is a thing that exists!

Picture of an IDE showing a Utopian Flag from the Terra Ignota series

You should try it out, and should probably not use it for critical applications! If you encounter problems, please file an issue or open a discussion on Github.

Like most of my work, I plan to keep working on it until I have run out of things to learn from the project. Also like most of my work, it's open-source under the MPLv2 license.

The Daily Front Page 19 of 31
Wednesday, September 30, 2026 The Daily Front No. #260930 — A Plea to Software Makers
article

Dear Software Makers

by speckx·▲ 85 points·60 comments·blog.jim-nielsen.com ↗
The skill of being a “creator” is not about maximizing views, retention, etc.

Marques Brownlee just released a video essay titled “Dear YouTube”.

I loved it.

He talks about how YouTube is going to start shipping this new feature where makers can essentially publish different “variants” of their videos and see which performs best (an A/B test).

Which immediately begs a lot of questions. Brownlee voices his:

  • If I’m watching a video, do I know if it’s part of one of these A/B tests?
  • If I’m reading the comments of a video, how do I know I saw the same thing as another commenter?
  • How do linked timestamps work?

It’s pretty wild when you think about it. I mean, imagine sending someone a link, “Check out this cool video!” And at that point you’re basically crossing your fingers, “I hope they see the same thing I did…”

Marques says he spoke to some YouTube engineers about these questions and they didn’t really have answers. They were kind of just like, “We don’t know — yolo! This’ll ship soon.”

So his video is a kind of plea to YouTube creators everywhere: Don’t use this feature!

There’s this sort of unspoken rule of community on YouTube, that like we’re all having this same experience together — we’re all watching the same video. That is what makes it a cultural phenomenon is that we all saw the same thing […] so letting people put up two or three different videos of the same thing at the same time kind of fundamentally breaks that, which doesn't feel right.

I agree, 100%.

Brownlee goes on to make a lot of great points in the video that, I think, can be applicable to making software as well. A few that stood out:

  • The skill of being a “creator” is not about maximizing views, retention, etc. It’s about finding creative ways to share stories, teach concepts, explore ideas, etc. Views, retention, etc. are all downstream of that.
  • Making (and finishing) something over and over and over is a better use of your time than making one thing and then trying all kinds of variants and obsessing over their varied performance.
  • When you focus on optimizing, you end up trimming out all the creative (and fun) stuff because those things won’t, by definition, ladder up to metrics of efficiency. (Moby Dick was not the most efficient way to tell that story.)
  • Stand by your creative choices. Learn from your wins and failures, then make the next thing. Have some conviction.

I find it interesting how Brownlee shares his opinion that YouTube spends way too much time chasing their competitors and not enough time being YouTube.

Which, when you think about it, is exactly the kind of place a feature like this would stem from: an insecurity in your own creative choices. How YouTube approaches its own insecurities is now trickling down as a feature to its users.

“Let’s let people make lots of variations on things, try all of them, and see what performs best” is exactly the kind of thinking you get in a platform that doesn’t know what it wants to be. So it’s left spending its time 1) doing what others are doing, and 2) following the fickle whims of whatever it can measure.

It’s like this adolescent attitude of, “I don’t know what I want to be, so I’m gonna imitate my peers and let others tell me what they think I should be.”

Anyway, that’s a long way of saying I liked the video. You might too. Hopefully you see the same thing I did, lol.

The Daily Front Page 20 of 31
Wednesday, September 30, 2026 The Daily Front No. #260930 — A Different Language Machine
repository

PSSA: A non-transformer language model written from scratch in Rust

by sparticle62·▲ 85 points·37 comments·github.com ↗
★ 83⑂ 7 forks Rust

A custom AI architecture being developed in rust

PSSA is a small language model that is not a transformer. It reads text one token at a time through a recurrent state-space layer, keeps a bank of episodic memories it can look things up in, and rewrites part of its own weights while it runs. It is written in Rust from scratch, with no PyTorch, no TensorFlow, and no ML framework of any kind underneath it.

At matched parameters and on the same corpus, it learns faster than a transformer and generates text about twelve times quicker on the same CPU.

Why Rust, and why that is not the point

Not for speed points, and not because the language makes the architecture better. PSSA needed per-token weight updates, a memory bank written during the forward pass, and a scalar reference path that every batched kernel could be differentiated against. Expressing that inside an autograd framework meant fighting the framework at every step, so the linear algebra is written directly instead. That made the plastic parts straightforward and the gradients checkable against a reference to around 3e-8. The architecture is the claim here. The implementation language is a detail, and a Python port is welcome.

How it differs from a transformer

PSSA block compared with a transformer block, with the measured held-out results

A transformer scores every pair of tokens in the context, so its cost per step grows with the square of the sequence length and the whole context is re-read at every step. PSSA carries one fixed-size state along the sequence in a single left-to-right pass, and looks things up in a memory bank instead of re-reading the context, so cost grows linearly with length.

The model

The PSSA layer, one token

Every token goes through one PSSA layer: a selective state-space recurrence, a bounded read from an episodic memory bank in hyperbolic space, a learned gate that decides how much of that read reaches the residual stream, and a SiLU MLP. The defaults are d_m = 256 channels, d_s = 16 states per channel, and a rank-16 adapter.

The recurrence

Write x for the layer-normalized token embedding. Three projections are read off the token itself, which is what makes the recurrence selective rather than fixed:

delta = softplus(W_delta x)      per-channel step size,  delta in R^d_m
B     = W_B x                    input map,              B in R^d_s
C     = W_C x                    output map,             C in R^d_s

The transition is diagonal, one rate per (channel, state) pair, kept negative by construction so the recurrence cannot blow up:

A = -softplus(A_raw)             A in R^(d_m x d_s)

Discretizing that continuous system with step delta gives the per-token update. h carries across tokens and across chunk boundaries during training:

Abar_ij = exp(delta_i * A_ij)
Bbar_ij = delta_i * B_j

h_ij <- Abar_ij * h_ij + Bbar_ij * x_i
y_i   = sum_j C_j * h_ij

A_raw is initialized so each channel's 16 rates sit on log-spaced timescales tau from 1.5 to 200 tokens, in the spirit of the HiPPO initialization. A single channel therefore starts out holding the last two tokens and the last two hundred at the same time, and training moves those horizons rather than discovering them from scratch.

Initialized decay envelopes

This half of the layer is a selective diagonal SSM and claims no novelty; it is the same family as S4 and Mamba, written out scalar-first so the backward pass can be checked term by term.

The memory read

The part that is specific to PSSA is what happens to y. A query is formed from both the current token and the current state, so retrieval is conditioned on where the recurrence has got to and not only on the token in hand:

q  = W_qx x + W_qh y
qh = proj(q)                     diffeomorphic map into the Poincare ball, |qh| < 1

The read is bounded at four slots, weighted by a softmax over hyperbolic distance at temperature tau_mem:

w = softmax(-d_H(qh, k_s) / tau_mem)   over the 4 nearest slots
m = sum_k w_k * v_k

Bounded hyperbolic read

Hyperbolic distance grows toward the boundary of the ball, so slots holding general context and slots holding one specific episode stay separable without widening the read. Four slots is a fixed cost per token regardless of how much the bank holds.

Gate, adapter, MLP

The read does not join the stream unconditionally. A learned per-channel gate decides how much of it lands, alongside a low-rank SiLU adapter that carries targeted updates:

g     = sigmoid(W_gate x)
z     = s * y + g (elementwise) W_proj m + adapter(x)
u     = W_2 silu(W_1 z)
z_out = z + u

The write path

Writes are the reason the architecture is called plastic. A slot is inserted when the incoming state is novel against what the bank already holds, each slot carries a refractory counter that rate-limits how often it can be overwritten, and fast plastic updates are folded back into the base transition matrix by a closed-form ridge regression rather than living in the external store forever:

A_base <- A_base + (H^T H + lambda I)^-1 H^T dH

The refractory counter is what keeps a stream of contradictory updates from erasing a slot that repeated evidence has already stabilized, and consolidation is what stops the bank from being the only place long-range structure is stored.

What is and is not new here

The recurrence is standard selective-SSM machinery. The claims are the hyperbolic bounded read conditioned on the recurrent state, the novelty and refractory rules on writes, and the ridge consolidation step from fast weights into the transition matrix. Everything is implemented against a scalar reference path that the batched and parallel implementations are differentiated against on every commit, currently agreeing to a maximum gradient error around 3e-8 (cargo run --release --example twin_check).

The result

Two models, same corpus, same tokenizer, same optimizer schedule, same seed, same number of parameters. One is PSSA, one is a standard transformer. Over 12.7M tokens of cleaned WikiText-103:

PSSA and the matched transformer on the same schedule

PSSA finished at 3.98 training cross-entropy, the transformer at 4.43. That is a gap of 0.45 nats, perplexity 53.7 against 83.7. The transformer spent its entire 12.7M-token budget to reach a loss PSSA had already passed around 2M tokens in.

The two curves never cross, and they never touch. Here is the PSSA run on its own, every logged update across the chain:

Held-out loss across the chain

29,243 logged updates, 7.63 down to 3.98, with a 41-point moving average drawn over the raw ticks.

It holds on text neither model has seen

Training loss only says a model fit the stream it was fed. So both checkpoints were scored on a 198,939-token slice cut from a part of the corpus neither run ever touched:

Held-out loss per checkpoint on unseen text

Every checkpoint of both runs, 64 PSSA links and 43 transformer links, scored on a bounded 9,934-token window of that unseen slice. The curves never cross: PSSA is ahead from the first link and finishes 0.51 nats lower. The table below is the final checkpoint of each run on the full slice.

Held-out slice, 198,939 unseen tokens PSSA Transformer
Cross-entropy 3.997 4.429
Perplexity 54.4 83.8
Next-token accuracy 24.1% 18.0%

The held-out gap, 0.43 nats, is essentially the training gap. PSSA is not memorizing harder, it is generalizing better.

And it is much faster to run

Throughput on the same CPU

Fixed work on the same 2 vCPU machine, 199,059 tokens at 512 tokens per update: 1,716 tokens per second against 415, so 4.13x. Both models were timed on CPU.

Learning-rate sweep

Both architectures put their optimum at the same learning rate, 0.003, so neither run is winning on a tuning advantage. The sweep is a short probe on a 120,000-token slice, a settings check rather than a final number.

Generating 200 tokens on the same CPU, same prompt, same sampler:

PSSA Transformer
200 tokens 226 ms 2,735 ms
Relative 12x faster baseline

A recurrent model carries a fixed-size state, so the cost of each new token does not grow with the length of what came before. A transformer re-reads its whole context every step.

What is actually different about it

  • A recurrent state-space core. Learned continuous state matrices carry information forward in a fixed-size state, instead of attention over the full context window.
  • An episodic memory bank. 512 slots with hyperbolic (Poincare-style) retrieval and bounded top-4 search, written to and read from during the run.
  • Plastic weights. Fast updates reinforce what works, novelty drives growth, and a refractory gate rate-limits overwrites so repeated contradictory input does less damage.
  • Closed-form consolidation. A ridge-regression step folds the fast plastic updates back into the base transition matrix, the way sleep consolidates a day's learning.
  • No framework. Hand-written linear algebra in Rust, with a CUDA path for training and a scalar CPU reference that every gradient is checked against (max gradient difference 2.98e-8).

What this is not

Being straight about the scale, because the numbers above are easy to over-read:

  • These are 1.5M-parameter models on 12.7M tokens. That is a research prototype, not a competitor to anything you have heard of.
  • Text quality at this scale is poor for both models. PSSA emits "a barget of the Prian Academy", the transformer "a material circulation of the United States". The comparison is about learning efficiency, not fluency.
  • The speed comparison is CPU-to-CPU, which is fair. The training throughput numbers further down are not hardware-matched and should not be read as an architecture result.
  • Two experiments are still unmeasured: retention of earlier skills after a corpus switch, and whether ablating the memory bank changes the loss.

Try it

git clone https://github.com/Sparticle62ops/pssa.git
cd pssa
cargo build --release
./target/release/oxide_ai_pssa

Running it with no arguments gives you a home screen listing every command plus any checkpoint and corpus it finds in the working directory.

Where the project needs help

Compute

The whole result above was trained on a free hosted notebook with a single entry-level GPU, in 200,000-token links, because a session gets cut after a few hours. Every interesting question left, whether the gap holds at 10x or 100x these parameters, whether the memory bank matters at scale, how it does against a modern recurrent baseline, needs one thing: a GPU with real VRAM and allocations measured in days instead of hours. Anything meaningfully above the entry-level card this ran on changes what can be asked.

If you have compute to grant, or you work somewhere that does, that is the single highest-leverage thing anyone can offer this project.

Sponsorship

Sponsorship funds compute and nothing else. In return you get named here and in the write-up of any result your hardware made possible. Get in touch before sending anything so the details can be agreed.

Contributing

Issues and pull requests are welcome. The parts most in need of hands: kernel performance, a modern recurrent baseline to compare against, and evaluation beyond next-token loss. Validate any branch with cargo test --release before opening a PR.

Contact

Sparticle62@proton.me

Donate

Solana: 4XPZ9uAa2BMoth6msoHRxTWL4mUrMfq3LGrxbAGja96h

Setup and codebase

Everything below is for running, training, and working on the project.

Requirements

  • Rust toolchain with Edition 2024 support, including Cargo.
  • Network access only when using an HTTP/HTTPS dataset or a Hugging Face dataset.
  • Enough memory and disk for larger corpora and serialized models.
  • Optional: a CUDA device for the GPU training path. The CPU path is the reference and always available.

Direct runtime dependencies are ureq for dataset downloads and tokenizers for byte-level BPE. A GPU is optional. Built with --features cuda the dense matrix work dispatches through cuBLAS with a device-resident weight cache; a WebGPU adapter is used for the same stages when CUDA is unavailable, and software adapters are refused because they are slower than the CPU path. Everything falls back to the CPU implementation with no feature flags.

How the comparison was run

How the two runs were matched

Both chains ran 64 links of 200,000 encoded tokens, each link resuming from the previous checkpoint, so the learning-rate schedule and optimizer state continue across the whole run instead of restarting per link.

  • Identical corpus: one clean-wikitext pass over WikiText-103, reused byte for byte.
  • Identical token IDs: the baseline pins --tokenizer-from to the PSSA chain's own checkpoint, so neither model sees a different vocabulary.
  • Identical optimization: 30,000-update cosine horizon, no warm-up restart, 512 supervised target tokens per update, seed 42.
  • PSSA: latent 256, recurrent state 16, 512 memory slots, key width 32, vocab 2,048.
  • Baseline: 1,541,120 parameters, 1 layer, width 256, 4 heads, FFN 448, vocab 2,048.

Matching the optimizer schedule cuts one way and not the other: neither model received tuning the other did not, but a schedule that suits PSSA is not guaranteed to be the transformer's best, so part of the gap could be an undertrained baseline rather than the architecture. A per-model learning-rate sweep is running now, both models swept over the same grid on the same token budget, and the best-against-best numbers will be posted here when it finishes, whichever way they come out.

Per-token learning curve

End-of-link training cross-entropy:

Link Tokens seen PSSA Transformer
ck01 200,000 5.733 6.461
ck05 1,000,000 4.617 5.467
ck10 2,000,000 4.447 5.082
ck15 3,000,000 4.292 4.858
ck20 4,000,000 4.185 4.704
ck25 5,000,000 4.221 4.704
ck30 6,000,000 4.070 4.561
ck35 7,000,000 4.039 4.523
ck37 7,400,000 3.960 4.465
ck44 8,800,000 4.004 4.480
ck48 9,600,000 3.937 4.415
ck52 10,400,000 3.846 4.344
ck56 11,200,000 3.887 4.375
ck60 12,000,000 3.972 4.418
ck64 12,800,000 3.982 4.428

The baseline's first session was cut at link 43 by the notebook session limit and its loss CSV did not survive, so links 1 to 43 are read back from that session's own run log instead. The chain resumed from ck43 in a second session and finished all 64 links, and both curves above now cover the full run.

Throughput is not hardware-matched

The headline training rates come from different machines and say nothing on their own: PSSA trained on a Kaggle T4 at roughly 900 tokens/second, while the baseline is CPU-only because train-transformer has no GPU path, and held 212 tokens/second there. For a comparison that means something, both models were trained on the same CPU-only box, a 2-vCPU container with no GPU, over the same 199,059-token slice of the cleaned corpus with seed 42 and identical update counts. PSSA held 1,716 tokens/second against the baseline's 415, so 4.1x on matched hardware and matched work. An earlier measurement on Kaggle's CPU, before the scan parallelization, put the same pair at 375 against 212. The loss comparison above is unaffected either way, since it is matched on tokens and updates rather than on time.

What these numbers are, and are not

The losses are end-of-link training cross-entropy on the stream being fit, not held-out evaluation. For a held-out comparison on an unseen slice, use the compare command described in docs/COMPARISON.md. Generation quality at this scale is poor for both models: PSSA emits "a barget of the Prian Academy", the baseline "a material circulation of the United States".

Two experiments are not yet measured: retention of earlier skills after a corpus switch, and whether ablating the 512 memory slots changes loss.

Reproducing

bash kaggle/kaggle_continue.sh              # the PSSA chain
bash kaggle/kaggle_transformer_baseline.sh  # the parameter-matched baseline

Both read TOTAL, WINDOW and FRESH from the environment and write --loss-csv, so the curve survives a cut session.

CLI Reference

General form:

oxide_ai_pssa <COMMAND> [OPTIONS]

Commands:

Command Purpose
train [source] Fit a checkpoint on a text corpus and write a .pssa file.
generate <prompt> Continue a prompt with a trained checkpoint.
chat [source] or repl [source] Interactive prompt loop against a checkpoint.
evaluate [source] Cross entropy, perplexity and accuracy as JSON.
status Checkpoints and corpora in the working directory. Takes no options.
download <repo> Pull a Hugging Face dataset to a local file.
clean-wikitext INPUT -o OUTPUT Stream-clean a raw WikiText file into a new UTF-8 corpus.
benchmark End-to-end smoke test on the built-in corpus.
gpu-probe Check whether a WebGPU compute device is usable.
help Print command and option help.

Options:

Option Default Applies to Description
-d, --data <source> data/downloaded.txt when present, otherwise science train, chat, evaluate Dataset source, or a comma-separated list.
-m, --model <path> data/model.pssa chat, generate, evaluate Checkpoint to load.
-o, --out <path> Command-specific; required for clean-wikitext train, download, clean-wikitext Output checkpoint or dataset path. Cleaning requires a new file.
-p, --prompt <text> empty generate Prompt text. Required for generation.
-e, --epochs <n> 4 train Training epochs.
-t, --temp, --temperature <float> 0.70 chat, generate Sampling temperature.
--max-new-tokens <n> 64 (maximum 100,000) generate Generation length cap.
--latent <n> 256 train Latent dimension.
--state <n> 16 train Recurrent state dimension.
--key <n> 32 train Memory-key dimension.
--memory <n> 512 train Memory bank capacity.
--chunk <n> 64 train Sequence chunk length.
--lr <float> 1e-3 train Base learning rate.
--accumulate <n> 8 train Chunks per optimizer update.
--warmup-steps <n> 0 train Linear warm-up before cosine decay.
--seed <n> 42 train Initialization seed.
--tokenizer <bpe|word> bpe train Tokenizer family.
--vocab-size <n> 2048 train BPE vocabulary maximum.
--max-tokens <n> unset train Global cap across input documents, not per document.
--skip-tokens <n> 0 train Skip this many tokens before training starts.
--resume <path> unset train Continue from an existing checkpoint.

Positional arguments and long/short options can be mixed:

cargo run --release -- train data/downloaded.txt -e 2 -o data/experiment.pssa
cargo run --release -- train --data data/downloaded.txt --epochs 2 --out data/experiment.pssa

Chat commands

Inside the REPL:

  • /exit or quit exits the process.
  • /info prints the loaded model path, memory slot count, and adapter count.
  • /temp <value> reports a temperature value but does not apply it to later turns. Pass --temp when launching chat instead.

Training over a long corpus

--skip-tokens, --max-tokens and --resume together let a long corpus be trained as a chain of short runs, so a single run never has to survive a session limit. If a window crosses EOF, selection wraps to the beginning of the corpus. Each link trains its own window and hands its optimizer state to the next:

cargo run --release -- train data/downloaded.txt -e 1 \
  --skip-tokens 0      --max-tokens 200000 -o chain/ck01.pssa
cargo run --release -- train data/downloaded.txt -e 1 \
  --skip-tokens 200000 --max-tokens 200000 --resume chain/ck01.pssa -o chain/ck02.pssa

kaggle/kaggle_continue.sh drives this pattern end to end: it sets a window size and a link count, walks the corpus offset by offset, and resumes each link from the previous checkpoint. status then reports every checkpoint in the chain with its shape and optimizer step count.

Dataset Sources

DatasetManager accepts one or more comma-separated sources:

cargo run --release -- train science                       # built-in reference corpus
cargo run --release -- train data/downloaded.txt           # local text file
cargo run --release -- train data/                         # every readable file in a directory
cargo run --release -- train https://example.org/corpus.txt
cargo run --release -- train hf:owner/dataset              # Hugging Face repository
cargo run --release -- train science,data/downloaded.txt   # multiple sources

Local files and directories are read directly; HTTP(S) URLs and explicit hf:owner/dataset sources are downloaded. Structured responses are reduced using common fields such as text, content, article, story, instruction, output, sentence, and summary; structured responses without a supported text field are rejected.

Byte-level BPE keeps exact UTF-8 case, whitespace, punctuation, and line endings, and has a complete 256-byte fallback alphabet, so valid UTF-8 never collapses to <unk>. The previous lowercase word splitter, including its 10,000-word cap and <unk> behavior, is available only with --tokenizer word.

Download a Hugging Face dataset into a local text file:

cargo run --release -- download wikimedia/wikipedia --out data/downloaded.txt

Network downloads are not validated or curated by Oxide AI. Review licensing, privacy, and content before training on an external corpus.

Cleaning WikiText raw corpora

Clean extracted wikitext-103-raw text before a fresh training run:

./target/release/oxide_ai_pssa clean-wikitext wiki.train.raw --out data/wikitext-clean.txt
./target/release/oxide_ai_pssa train data/wikitext-clean.txt -o data/model.pssa
# Also available: oxide_ai_pssa help clean-wikitext

The same command can be used in Kaggle after extracting text from Parquet; it accepts a local UTF-8 text file, not Parquet itself. -o and --out are aliases. The output path is required and must not already exist (including the input path or a link to it). This protects the original corpus; choose a new output name for another run. Read, UTF-8, and write failures exit nonzero through the normal CLI error path, with partial output removed when possible.

The pass:

  • Joins @-@, @.@, and @,@ to adjacent text: guest @-@ starring → guest-starring, 52 @.@ 9 → 52.9, 500 @,@ 000 → 500,000.
  • Drops balanced heading lines such as = Title = and = = Section = =.
  • Removes <unk> and collapses remaining inline whitespace to single spaces.
  • Removes spaces before ., ,, ) and after (; trims each line.
  • Retains at most one consecutive blank line, including at the start/end. Removing a heading does not introduce a blank line.
  • Writes LF line endings, including a newline on the last retained line.

oxide_ai_pssa::dataset::clean_wikitext(reader, writer) is the reusable library API (BufRead / Write, returning std::io::Result<()>). The CLI uses buffered file I/O, and the cleaner retains only its input/output line buffers: memory is proportional to the longest line, not the corpus size. Library callers using a buffered writer must flush it themselves; the CLI explicitly checks the flush. No new dependencies are required.

Cleaning is opt-in: existing loaders, tokenizers, training commands, and kaggle/kaggle_continue.sh are unchanged. Do not switch an in-flight resume chain to a cleaned corpus: cleaning changes token IDs/counts and the meaning of --skip-tokens offsets. Prepare and consistently reuse one cleaned corpus for a new chain instead.

Training Pipeline

The train command performs two phases:

  1. Continuous recurrent ingestion: token transitions are processed through the PSSA layer. The model updates state, memory, adapters, and routing behavior with a cosine learning-rate schedule.
  2. Adapter consolidation: after each epoch, the plastic adapter's fast coefficients are folded into its consolidated coefficients with the configured EMA rate.

Defaults are latent 256, recurrent state 16, memory-key 32, memory capacity 512, chunk length 64, learning rate 1e-3, 8 chunks per update, and seed 42. The resulting binary holds weights, configuration, memory, adapters, and optimizer state. It is not an interchange format for other ML frameworks and should be loaded through PSSALayer::import_from_pssa_bytes.

Checkpoint compatibility

New saves use V7: the full V6 training/resume payload plus a bounded, length-prefixed standard tokenizer JSON. A V7 BPE checkpoint is self-contained and restores its exact ordered vocabulary without access to the training or evaluation corpus. generate and chat reject --data for V7 BPE because retraining a tokenizer on external data would not validate provenance. V7 word checkpoints and V6 checkpoints retain the legacy optional --data exact-vocabulary comparison. Checked V5 artifacts remain inference-only and require --data because they never contained tokenizer provenance.

Inference

Generation is autoregressive and uses temperature 0.70, a top-24 candidate limit followed by top-p 0.85 filtering, a 1.25 repetition penalty over a recent 64-token window, immediate self-transition suppression, <unk> suppression, and a default cap of 64 new tokens, ending early after two generated periods.

V7 BPE inference restores the exact embedded tokenizer and never rebuilds it from a selected dataset. Evaluation supplies its data only as held-out text to the restored tokenizer.

Benchmark

cargo run --release -- benchmark

The suite exercises synthetic streams for contradictory facts, MQAR-style distractors, burst repetition, model serialization, and short generation prompts. It prints milestone results, is not wired into Cargo's test harness, and is not a quality evaluation on general language tasks.

Project Layout

Path Responsibility
src/main.rs Binary entry point; forwards process arguments to the CLI.
src/cli.rs Argument parsing, home screen, training, chat, generation, evaluation, status, download, and benchmark orchestration.
src/ui.rs Terminal presentation: logo, panels, spinners, progress bars, ANSI-aware width handling.
src/dataset.rs Tokenization, vocabulary construction, built-in corpora, local and remote loading, streaming WikiText cleaning.
src/pssa.rs PSSA layer, forward pass, plastic learning, consolidation, and .pssa serialization.
src/checkpoint.rs Checkpoint format versions, resume payloads, and import/export validation.
src/inference.rs Autoregressive sampling and generation constraints.
src/backend.rs GEMM dispatch, CPU reference kernels, and the WebGPU device probe.
src/memory.rs Fixed-capacity hyperbolic memory bank and retrieval/update logic.
src/adapter.rs Low-rank modular adapter projections and updates.
src/defense.rs Refractory rate-limiter primitives for stable updates and overwrite defense.
src/linalg.rs Small allocation-conscious vector, matrix, math, and deterministic RNG utilities.
src/diagnostics.rs CLI banner formatting.
kaggle/ Chained-training driver for long corpora on a hosted notebook.
data/downloaded.txt Checked-in corpus used as the default when present.
data/model.pssa Checked-in serialized model artifact.

Development

cargo fmt --all -- --check
cargo clippy --release --all-targets
cargo test --release

Integration tests live in tests/: allocations.rs, bpe_repair.rs, checkpoint_repair.rs, core_repair.rs, linalg.rs, and runtime_repair.rs, with shared artifacts under tests/fixtures/. They cover tokenizer round trips, checkpoint import/export across versions, linear-algebra kernels, allocation behavior, and CLI runtime output. Clippy is clean of errors; a number of style warnings in the numeric kernels are left in place deliberately, since rewriting indexed loops there would churn code the gradient tests pin down.

Limitations

  • CPU-oriented prototype with hand-written linear algebra. gpu-probe verifies a WebGPU device and a GEMM against the CPU reference, but training and inference still run the layer math on the CPU.
  • The CLI parser is intentionally minimal: no shell-style quoting, and little validation beyond numeric parsing.
  • A missing or unreadable dataset silently falls back to the built-in science corpus in several loading paths.
  • Model and tokenizer vocabularies must remain compatible; a size warning does not repair a mismatch.
  • Model shape cannot change across a resume chain: latent, state, key, memory and vocabulary must match the checkpoint being resumed.
  • Downloaded content can be large and may contain JSON, malformed text, or data unsuitable for training.
  • The REPL temperature command acknowledges a value without changing the active configuration.
  • Benchmark output is milestone-oriented and does not measure perplexity, factuality, latency, or safety.
  • Serialized .pssa files are project-specific binary artifacts without version migration tooling.

License

See LICENSE for the project license.

The Daily Front Page 21 of 31
Wednesday, September 30, 2026 The Daily Front No. #260930 — Mathematics in Public
article

Responsible Release of AI-Generated Mathematics

by aureianimus·▲ 83 points·104 comments·agmai.org ↗
We do not endorse this practice, and we ask them to stop testing advanced mathematical problems on proprietary models.

Responsible Release of AI-Generated Mathematics

At present, some frontier AI labs are testing advanced mathematical problems on proprietary models that remain inaccessible to the broader scientific community. Our recommendations are formulated with this practical context in mind. However, ideally, they would not do so. We want to state clearly from the start: we do not endorse this practice, and we ask them to stop testing advanced mathematical problems on proprietary models.

1. Background

The mathematical community has long-standing norms concerning the dissemination and peer review of results. These norms have been essential for the reliability, trustworthiness, and effectiveness of mathematical work. One of the most important scholarly norms in mathematics is that the authors of a paper should understand the mathematical argument of that paper, have verified its correctness themselves, and take full responsibility for the content. Moreover, in the mathematical community, authors of works that significantly advance the field regularly give seminars at other institutions and talks at conferences, explaining their new developments and answering questions from colleagues. This all works towards developing the deepest possible human understanding of mathematics, which is one of the crowning glories of millennia of human development.

However, it is now the case that AI can output mathematical arguments in situations without the human who prompted it being able to understand the arguments, verify them, or take responsibility for them. We believe that human understanding of mathematics remains of paramount importance. How, in this new era, can we work towards a new paradigm that includes human understanding of mathematics as part of responsible scholarly output?

We asked the mathematical community for feedback about what it would mean for AI labs to responsibly release mathematical results1 and received over 600 replies. Informed by these responses, we arrived at a set of recommendations, supported by a clear plurality of respondents, aimed at any AI lab whose models are likely to have a significant impact on mathematics. The overarching principles underlying these recommendations are the following.

  1. If AI labs produce significant mathematical results, they should responsibly release the results, as outlined in this document, as soon as possible.
  2. AI labs that release substantial mathematical output without immediate accompanying human understanding must take responsibility for ensuring that human understanding will follow. In particular, AI labs should provide significant support, including funding, to help develop this understanding.
  3. The development of human understanding must remain organic and community led. It should not be directed by AI labs, even when the labs have produced the results.

We present our recommendations themselves in Section 2, and in Section 3 we make some comments about access to powerful models.

2. Responsible release of results generated by AI labs

We recommend two possible courses of action, depending on the level of human understanding that accompanies a result.

2.A. Papers that a human understands

Papers for which there is a mathematician responsible who fully understands the content should follow the academic mathematical community’s traditional norms: the mathematician(s) concerned should post a preprint, submit a paper for peer review at a journal, and give talks to explain the work to other mathematicians.

2.B. Papers that are not yet understood by anybody

The recommendations below are for labs that have AI mathematical output that is not understood by the people who prompted the AI systems. They are split into two parts. The first part is a set of proposed technical norms for the release of AI-generated mathematics. The second part is a recommendation that AI labs provide support for the additional mathematical activities that are needed for humans to be able to understand and assimilate their AI-generated mathematical output and identify possible applications of it.

Step I: Initial release

  1. With the help of LLMs, it is easy to make substantial improvements to the initial written version of an AI-generated result. The following actions should be carried out by the AI labs rather than left to mathematicians afterwards.

    (a) The literature should be scoured for any ideas that are related to the ideas in the proofs of the results released. Even if the AI lab’s model discovered those ideas independently, it should follow standard mathematical practice and cite the papers in which the ideas were first introduced.

    (b) The model, or some other model, should be prompted to produce a version of each proof that is written up in a style that follows the conventions of a traditional mathematical paper. They should contain friendly introductions and precise theorem statements and proofs. They should not be full of wordy reasoning and non-standard terminology that renders them virtually incomprehensible.

The current abilities of LLMs may not be able to reproduce the level of attribution or quality of exposition that we expect of mathematicians, and thus more important work from mathematicians after release may be needed to reach this standard. If so, this should be supported as described in Step II. However, inability to reach a high standard does not absolve AI labs of the responsibility to do the best they can with their models on the two points above.

  1. When results are announced, they should be deposited in a timely manner in appropriate scholarly repositories. These should not be controlled by any AI lab and should guarantee certain standards, including that submissions have a persistent citable identifier and that subsequent modifications are appropriately recorded. For AI-generated results, it would be particularly useful if the repository allows for comments on papers.

We strongly recommend that AI labs refrain from treating the release of mathematical results as marketing vehicles to promote their models, ignoring the substantial negative externalities that this practice inflicts on the mathematical community.

  1. For each result released, the AI lab should make public the name of the model, the prompts used, a (summarized) chain of thought, the time taken, and the estimated cost of computation. Releasing additional material that sheds light on the scientific process that produced the results, such as the initial LLM outputs before they were cleaned up (as recommended in (1) above), is strongly encouraged.

  2. As far as possible, a proof released by an AI lab should be formalized. Formalization artifacts should meet community standards, including having copyright headers, a challenge file for comparator, and a formalization.yaml. It would be helpful to include machine-readable metadata correlating the natural language and formal artifacts. Where formalization would lead to unacceptable delays, the formalization status of the paper should be clearly stated. For example, perhaps it has been formalized modulo standard results that are accepted by the community

  3. Each time a solution to a problem is released, it should be clearly documented how exactly AI came to be used on that particular problem. If many results are released at once, then in addition to the results themselves a further document should be written and made public that references all of the released results and explains how many other problems of comparable difficulty the models tried and failed to solve, as well as how the problems were chosen.

Step II: Supporting human understanding

One of our principles is that AI labs have a responsibility to provide support, including funding, for the development of human understanding of the AI mathematical output that they release. Here we give more detail about what such support might be used for, though the ultimate decision about which particular efforts are supported should be taken neither by this group nor by AI labs, but by separate, already existing nonprofit institutions that have established processes for distributing funding. The scope of the appropriate level of support should depend on the importance and complexity of the released AI output, as these features determine the amount of work that will be needed to support human understanding of the output.

A few examples of activities that could be supported are the following.

  1. For results with highly complex proofs or results that could open many new avenues of investigation, conferences or summer schools dedicated to understanding them could be critical for analysis and understanding of the proofs so they can be applied in future mathematical developments.
  2. For other results, a more targeted workshop or a longer-term working group may be necessary. For long-term work, postdocs or students might be supporting the work and thus need to be funded.
  3. For some results, it would be useful to support experts to write books or long expository articles.

It should be understood that the acceptance of such support by the mathematical community would not be conferring legitimacy on the practices of the AI labs. Rather, it would be asking the AI labs to make an appropriate contribution to fulfilling their responsibility towards the development of human understanding of their AI output.

3. Ensuring broad access

The use of proprietary internal models by AI labs to do mathematical research risks creating a two-tier system where labs outrun the rest of the field, effectively alienating the mathematical community from its own discipline.

As for publicly available models, unequal access due to economic and other factors risks establishing a multi-tier hierarchy across the mathematical world and greatly exacerbating existing inequalities that arise from institutional wealth and technological privilege.

We therefore advise the AI labs to grant the global mathematical community broad, equitable access to their publicly available models: this is a way both to accelerate progress and to ensure wide access to it. Mathematics advances primarily through collective verification, conceptual synthesis, and shared intuition, none of which can thrive when some instruments generating frontier results are accessible only to a select few.

1The survey asked about a specific situation in which OpenAI announced the existence of many results without giving details.

The Daily Front Page 22 of 31
Wednesday, September 30, 2026 The Daily Front No. #260930 — Algorithms, Infrastructure, and Agents
The Daily Front Page 23 of 31
Wednesday, September 30, 2026 The Daily Front No. #260930 — Algorithms, Infrastructure, and Agents
repository

Launch HN: Magnitude (YC S25) – Self-optimizing inference engine for agents

by anerli·▲ 137 points·61 comments·github.com ↗
★ 5,770⑂ 398 forks Rust

Open source inference engine for agents that optimizes itself for your exact hardware. Compiles and tunes its kernels on your device, so open models run up to 2x faster than llama.cpp. Works on Apple Silicon, NVIDIA, AMD, or just a CPU.

Magnitude icon

Magnitude

Run open models as fast as your hardware allows

Download Magnitude Documentation Discord Follow Magnitude on Twitter GitHub Repo stars

Magnitude is an open source inference engine for agents that optimizes itself for your exact hardware. It compiles and tunes its kernels on your device, so open models run up to 2x faster than llama.cpp. One click connects the agent you already use (Pi, OpenCode, Hermes, Codex, and more). Works on Apple Silicon, NVIDIA, AMD, or nothing but a CPU.

Download Magnitude for macOS, Windows, or Linux

⭐ Help us reach more developers and grow the Magnitude community. Star this repo!

demo-9-29.mp4

Get started

  1. Download Magnitude, install it, and open the app.
  2. Choose a recommended model in Discover and download it.
  3. Connect your agent in Connections and start using it.

The desktop app includes the magnitude CLI. No separate installation is needed.

Why Magnitude?

  • Up to 2x faster than llama.cpp: 92% faster decode on Metal, 19% on CUDA
  • Tuned on your device: kernels are tuned on your hardware before a model runs
  • Built for the best models: hand-optimized kernels for popular open-weight families
  • Memory that flexes: 27% less memory per agent, freed when agents stop
  • Fast concurrent sessions: sessions share prefix caches to prevent slowdown
  • Works with your agent: one click to connect Pi, OpenCode, Hermes, Codex, and more
  • Free, private, open source: no token costs, nothing leaves your machine, Apache 2.0

Up to 2x faster than llama.cpp

Magnitude vs llama.cpp: 9% faster prefill and 92% faster decode on Metal, 23% faster prefill and 19% faster decode on CUDA

FAQ

What is Magnitude?

An open source inference engine that optimizes itself for your hardware. It ships as a desktop app that runs open models and connects them to the agent you already use.

How is it faster than llama.cpp, Ollama, or LM Studio?

They ship kernels precompiled for broad classes of hardware. Magnitude compiles and tunes its kernels on your actual device before a model runs, so they fit your exact chip. See the benchmarks against llama.cpp.

What hardware do I need?

Any Apple Silicon, NVIDIA, or AMD GPU, or nothing but a CPU. There is no fixed minimum. Smaller machines run smaller models, and more memory lets you run larger ones.

What operating systems does it support?

macOS, Linux, and Windows.

Which models does it support?

See the full list at magnitude.dev/models. We write optimized kernels for the most popular open-weight families, which is how we beat generalist engines.

Which agents work with it?

One click connects Pi, OpenCode, Hermes, OpenClaw, Codex, Claude Code, Oh My Pi, and Cline. Anything else works through the OpenAI-compatible API.

Is it private?

Yes. Prompts, files, and models stay on your machine. No internet needed once a model is downloaded.

The Daily Front Page 24 of 31
Wednesday, September 30, 2026 The Daily Front No. #260930 — Algorithms, Infrastructure, and Agents
article

Most data centers refusing to say how much water, electricity they use

by Thom2503·▲ 205 points·190 comments·nltimes.nl ↗

The vast majority of data centers in Europe keep information about their environmental impact secret, according to a study by Lighthouse Report in collaboration with Trouw and other European media. In the Netherlands, less than a quarter of larger data centers publish data about their electricity and drinking water usage.

The researchers spent a year trying to obtain data on data centers’ environmental impact in Europe, invoking freedom of information laws in various European countries. Their attempts have yielded no results.

The European Energy Efficiency Directive (EED) obliges data centers with an installed capacity of at least 500 kilowatts (kW) to report data including their energy and water consumption. In practice, few do so, despite the directive being in effect for three years.

According to the Dutch Datacenter Association (DDA), there were 186 commercial data centers with a capacity of 500 kW or more in the Netherlands at the end of last year. The Netherlands Enterprise Agency (RVO), which collects the information for the EU, has data on only 104 of them.
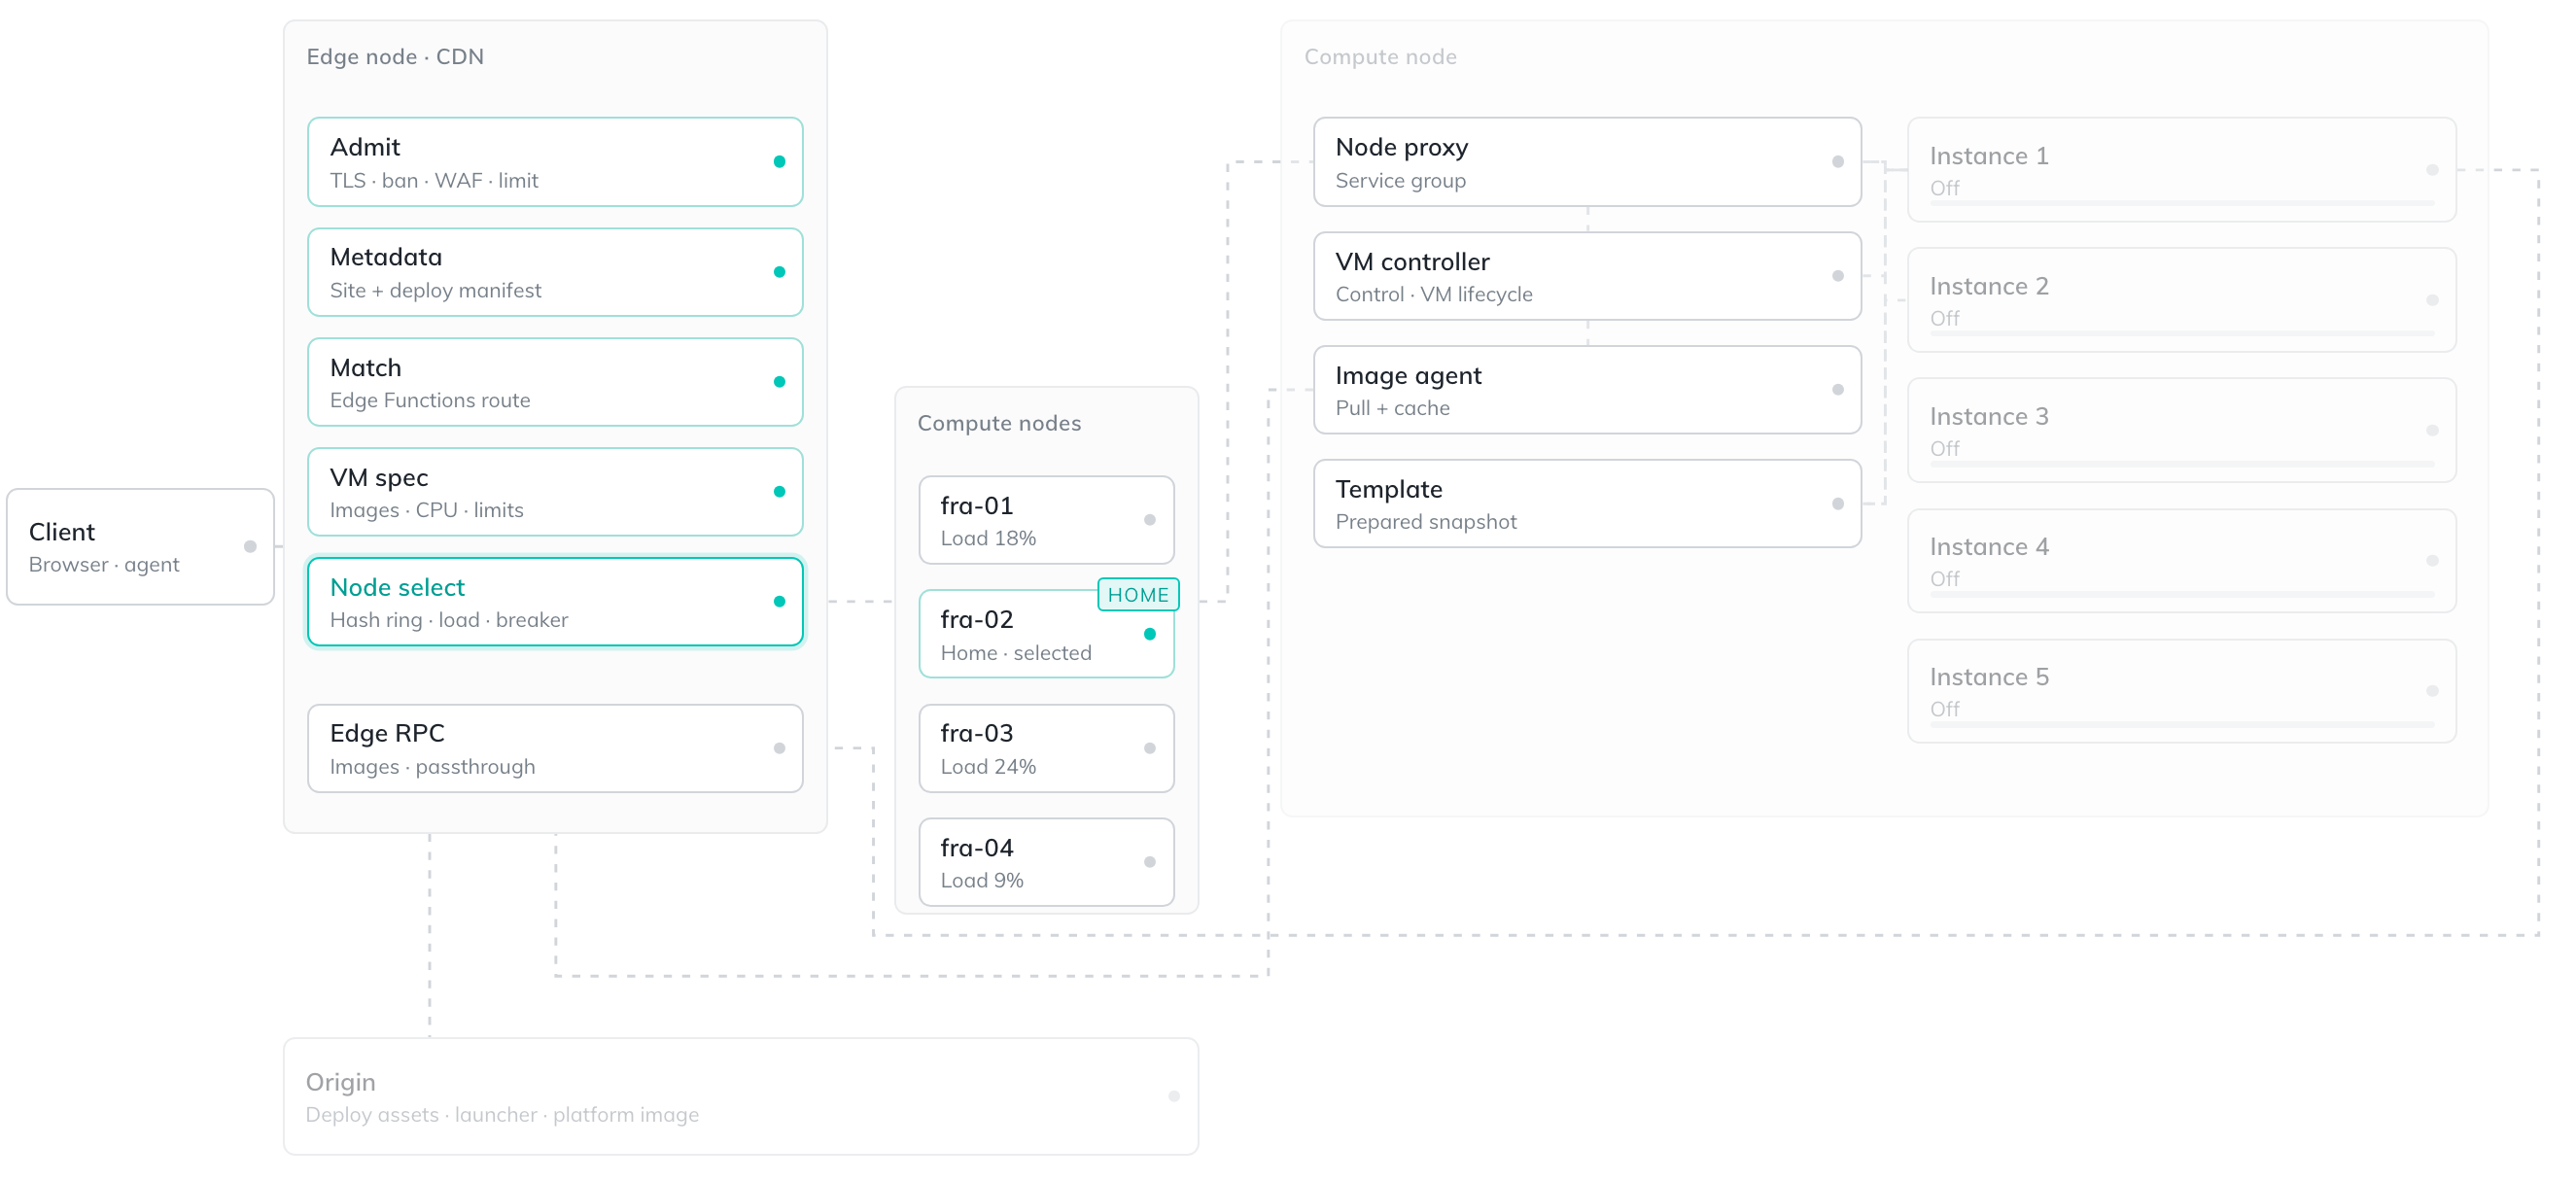
The RVO also lacks crucial data regarding water and energy consumption. Public figures exist on the electricity usage of 44 centers and the water usage of 47 - less than a quarter of the larger Dutch data centers. The RVO told Trouw that it has more data on some centers, but did not provide figures.

Data centers have become increasingly prolific in recent years with the rise of first cloud services and then AI applications. The number of data centers has skyrocketed, and with them the consumption of electricity for operations and drinking water for cooling the thousands of servers involved.

According to the latest figures from Statistics Netherlands (CBS), data centers used 5.1 billion kilowatt-hours of electricity in the Netherlands in 2024. That is 4.6 percent of the country’s total electricity consumption, a near doubling in five years. Grid operator TenneT projects that data centers will consume 10 to 15 percent of the Netherlands’ electricity by 2030. That while a lack of grid capacity has businesses, institutions, and even housing developments on waiting lists.

Data from the RVO revealed this summer that Microsoft’s largest data center in the Netherlands alone accounts for 1 percent of the national electricity consumption. Google, which has two large data centers in the Netherlands, does not disclose this information.

Little is known about data centers’ water usage. In the Netherlands, it is estimated that they account for about 0.1 percent of total consumption. That is a small proportion, but climate change is making conservative water usage increasingly critical with prolonged periods of drought and water shortages.

The Daily Front Page 25 of 31
Wednesday, September 30, 2026 The Daily Front No. #260930 — Working Notes and Small Histories
article

The last time my family was replaced by technology

by megalomanu·▲ 198 points·447 comments·manuel.darcemont.fr ↗

My great-great-grandfather thought he’d be replaced by technology too.

He was a farrier in Mandres-en-Barrois, the small village in rural France where I grew up. Shoeing horses, repairing farmers’ carts. Then he saw a car drive through the next town over, or read an article about it in the paper. I can’t tell what exactly happened in his mind at that moment, but soon after, he became a mechanic, like every man in the family after him.

In the end, and maybe after a long stretch of grief at trading his horses for engine grease, he kept his purpose: helping people get around. He just changed the technology, going from horses to engines.

I think about this a lot these days, surrounded as I am by so many developers who wake up every day wondering what’s going to become of them. I must say there is some comfort in knowing that someone in my family had the same doubts before me.

Because, yes, we love to say AI is the biggest revolution since the Industrial Revolution, and that we’re going through a transformation unlike anything we’ve seen before. But that overlooks the farmers who watched the tractor roll in, or the farrier who watched the car arrive. Back then, the revolution was often right next door, hitting your neighbour. They didn’t have X to doomscroll first thing in the morning (lucky them), but they too wondered what on earth they were going to do, imagining the worst.

A century later, the torments felt by my great-great-grandfather are forgotten. The garage feels like it has always been in the family. My father loved his job like few people I know, as if it had run in the family forever. We just kept doing what we had always done: helping people get around. Just as some families in the village still farm the same fields today, mine kept the same purpose.

Not every farrier became a mechanic, and I’d never have heard of the ones who didn’t. So I won’t pretend his story proves anything. But it makes me wonder: what if what we loved about this job was never only the code?

Many of us, deep down, are driven more by the joy of making things, solving problems, and seeing people use what we built than by the act of coding itself. After all, many of us decided we wanted to be developers before learning to code, just to create video games or websites. The desire came before the code.

Be willing to let go of the how to hold on to the why.

The Daily Front Page 26 of 31
Wednesday, September 30, 2026 The Daily Front No. #260930 — Working Notes and Small Histories
article

RSS Feeds for Last.fm

by Baljhin·▲ 124 points·42 comments·lfm.xiffy.nl ↗

So you we're looking for the RSS Feed of Last.fm, and then discovered they were gone!

Well, the solution is right here, all you have to do is tell me your username and i'll give you four URLs, one for you recent tracks, one for your loved ones, one for your top tracks and one for your top artists (the last two with an optional period, defaults to 1 month).

also new: images! if last.fm adds something other than a default image, it's large version is added as an enclosure

2025: Added support for recommended tracks. This comes bot in RSS as Soundixx-compatible JSON format.

Example URLs (thexiffy)

Recent tracks

https://lfm.xiffy.nl/thexiffy

Loved tracks

https://lfm.xiffy.nl/thexiffy/loved

Top tracks

https://lfm.xiffy.nl/thexiffy/toptracks
https://lfm.xiffy.nl/thexiffy/toptracks?period=6month

Top Artists

https://lfm.xiffy.nl/thexiffy/topartists
https://lfm.xiffy.nl/thexiffy/topartists?period=7day

period can be: 7day, 1month, 3month, 6month, 12month or overall

Recommended tracks

https://lfm.xiffy.nl/thexiffy/recommended

Recommended tracks in JSON format

https://lfm.xiffy.nl/thexiffy/recommended/json

In 2016 I wrote:

Last.fm the musicservice I love to hate. Last year they had a complete redesign of the site and took down a lot of functionality. Things happen but I wasn't too pleased. The site looked better, but where was the functionality? "Not to worry" they said. "All will be back". After a year of waiting I gave up hope, just as many other people gave up hope. Everything what made last.fm great to use, and added value was gone. Still is gone and it will probably never return. So... I started to scrape the bloody site and created (in a couple of hours) what they can't/won't in a year. RSS-Feed of your recent and loved tracks.
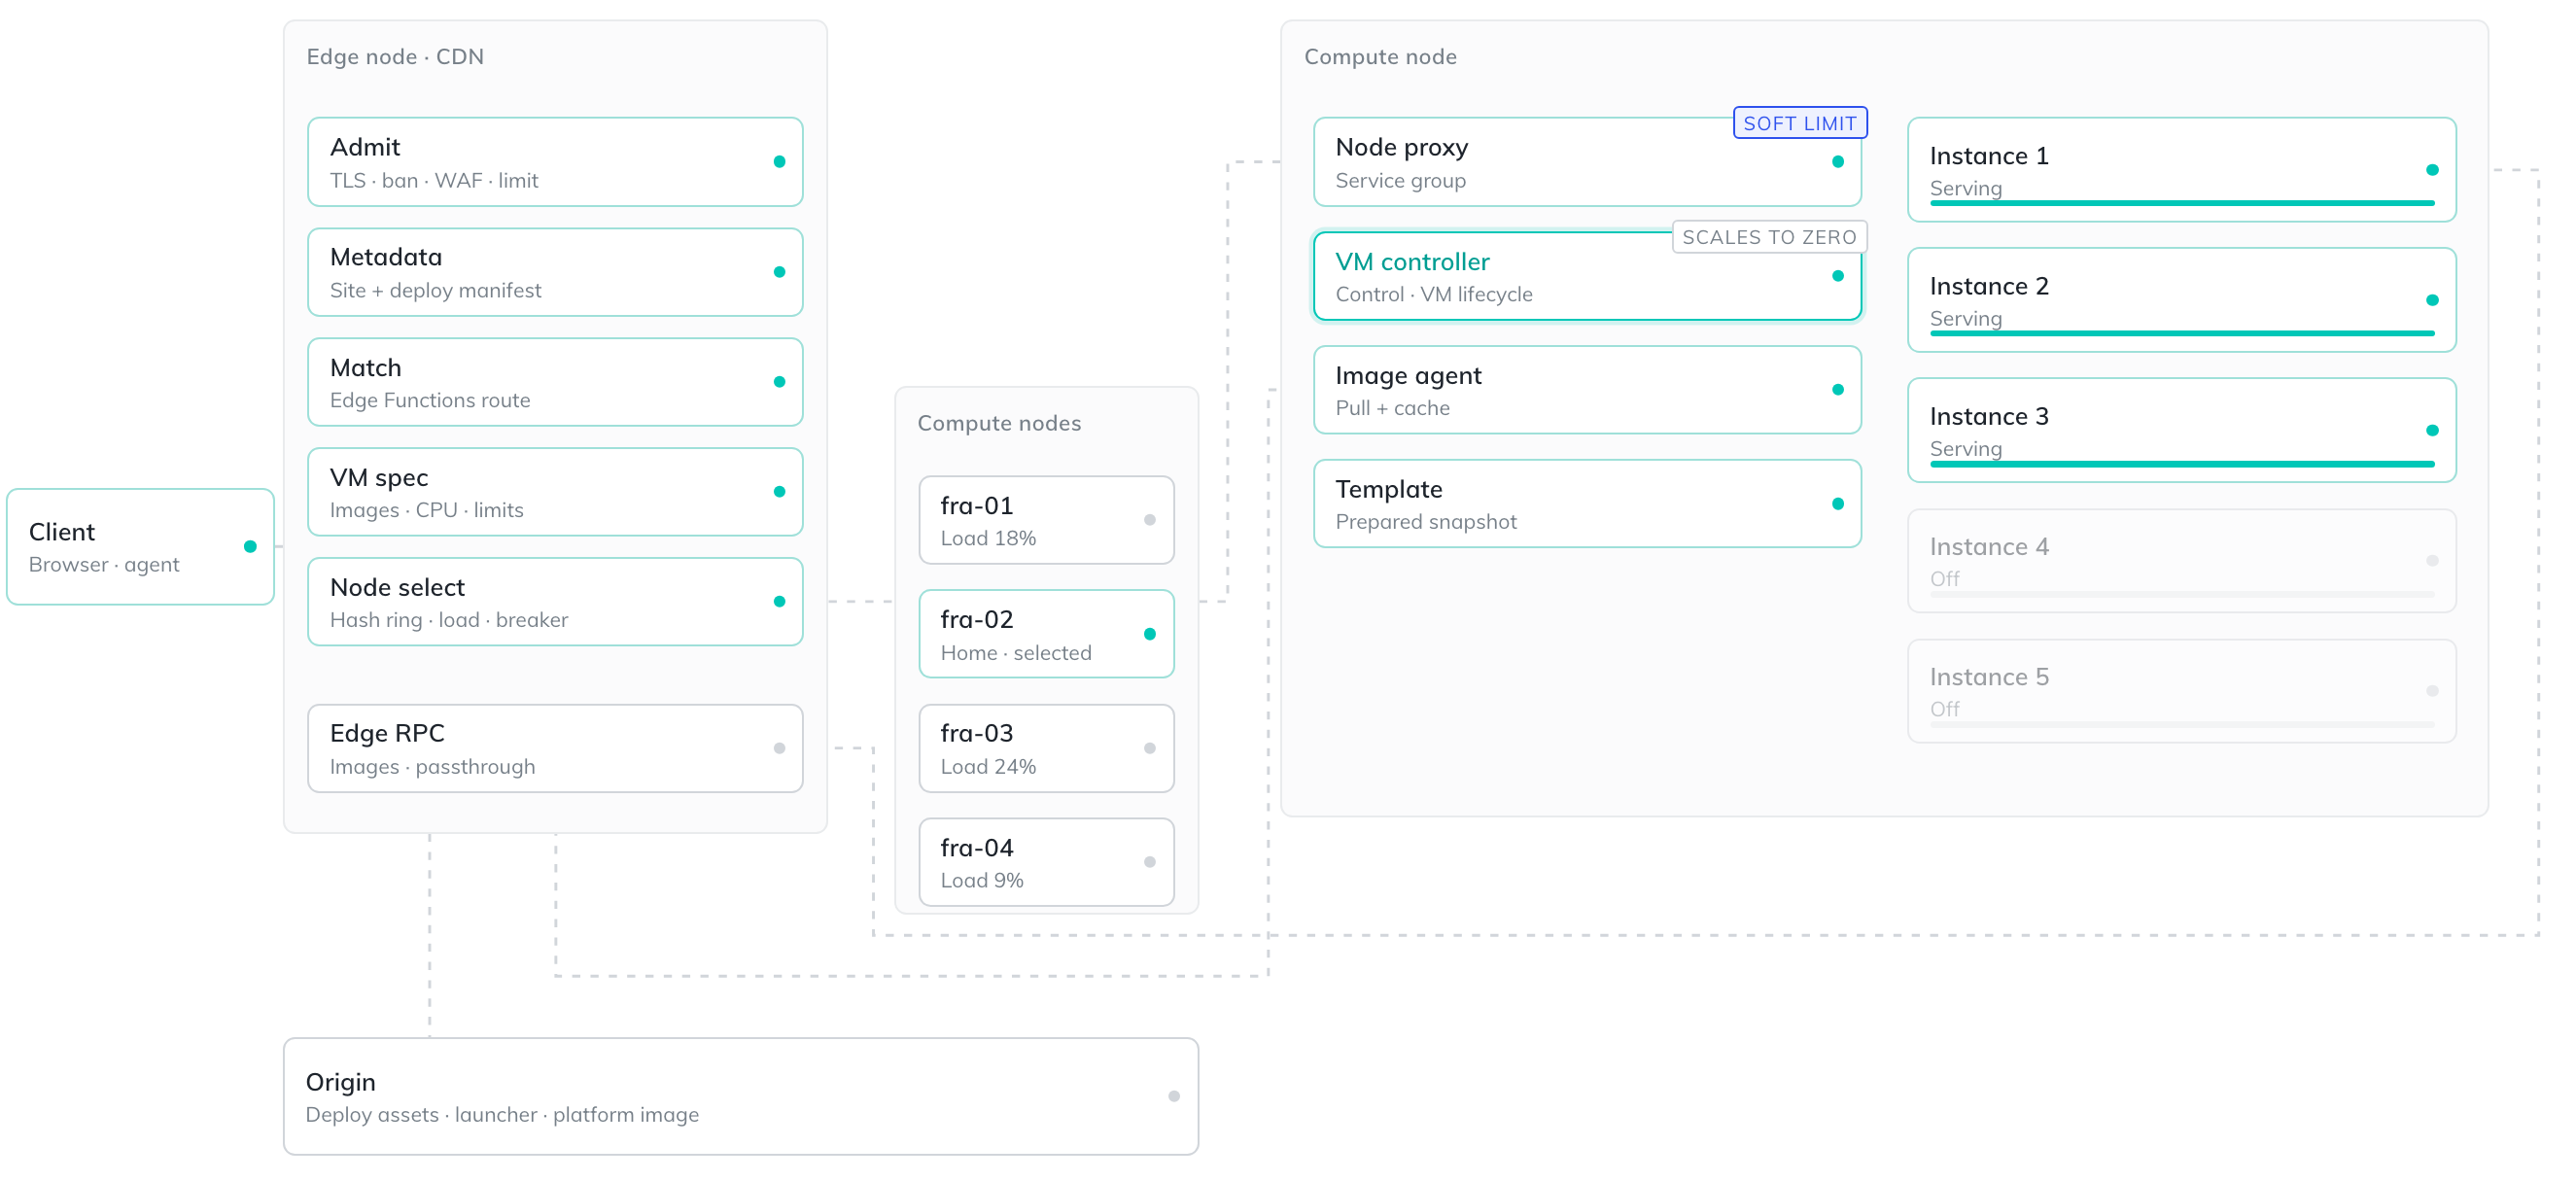
The Daily Front Page 27 of 31
Wednesday, September 30, 2026 The Daily Front No. #260930 — Working Notes and Small Histories
article

Commit description as a thinking tool

by yedhukrishnan·▲ 108 points·62 comments·yedhu.me ↗

Before the AI era, I wrote pretty long commit descriptions (or commit bodies) for major changes. It took me about five to ten minutes to draft and reread them to make sure I didn’t miss anything important. I did that for several reasons.

I wanted to include all the useful information so readers wouldn’t have to hunt for it in multiple places.

I wanted to explain what and, more importantly, why. The “what” summarizes the changes that are generally self-explanatory, but it gives a starting point for explaining the “why.”

Sometimes, I write it in first person, like I am drafting a message for someone: “I did this because…”, “I am doing this until we…” etc. I then go ahead and explain why, so that it is easier for others, and most importantly for my future self, to understand why we made that change.

It was a good exercise. It wasn’t just about writing the commit message and description. The writing process itself helps me reflect on the code I wrote. I reread the code and summarize the changes. During that process, I tend to re-evaluate the decisions, and sometimes that leads to a different or better change.

Now we are in the era of agentic coding, where everything from code to commit descriptions is written by AI. There is a huge debate on whether we should read the AI-written code, and how difficult that is in terms of readability. The part I find difficult is reading and understanding AI-written commit descriptions.

Agents can write commit messages for the changes they make. But they may not have the full context that is spread across different communication and project management tools. Some of those might be offline too. When the AI doesn’t know the ‘why’ part, it comes up with its own reasoning. I find that dangerous. When we read that later, it may not make sense, because the real reason was completely different.

One obvious solution is to give the agent all the context it needs, through chat or tools. This helps to fix the issues with fabricated reasoning. The agent can now explain the “why” clearly.

But this doesn’t fix the other problem. The agent with the right context will write a convincing commit message. But only I can verify if the code does what the description says. So, here is something I do:

Write the commit message and description myself.

Here is why.

Writing a commit description myself helps me to reflect on the changes AI made. It is also a way to check if everything is as intended. If I cannot explain “why,” I am shipping something I don’t understand, which will be hard to explain or fix if it breaks later. It goes back to the old quote. If you cannot explain it, you did not understand it. The commit description again works here as a thinking tool.

Some parts, like “I am doing this until we…”, are temporary decisions with exit criteria. We sometimes set exit conditions, and AI cannot infer them from code or other tools because they are usually not written down anywhere since they seem too obvious to mention. But writing the commit message forces me to complete that sentence, and it helps future readers decide whether to keep that change.

The agent can write the code and the description. But writing why is where you find out whether you understand what you are shipping.

The Daily Front Page 28 of 31
Wednesday, September 30, 2026 The Daily Front No. #260930 — Working Notes and Small Histories
article

Ballmer Peak

by thunderbong·▲ 86 points·31 comments·en.wikipedia.org ↗

The Ballmer Peak is a humorous concept invented by Randall Munroe in the xkcd webcomic, joking that a programmer who is appropriately intoxicated (between 0.129-0.138% BAC) will achieve a high level of programming productivity; the peak occurs at 0.1337%, a reference to leet. The concept is loosely tied to former Microsoft CEO, Steve Ballmer,[1][2] and is likely a play on Balmer series of hydrogen spectral lines named for the scientist Johann Balmer.[3]

A San Francisco organization, Originate, has organized a "Ballmer Peak-A-Thon", an open bar event where people were given "5 hours to find the elusive Ballmer peak, and build the best worst business possible."[2][4]

There is no scientific basis for the Ballmer Peak, though researchers have studied adjacent topics, such as the impact of inebriation on problem solving.[5] One study identified worse programming performance with increasing blood alcohol content, but joked in a footnote that as "the prescribed BAC in this experiment did not reach the Ballmer Peak", they did not technically refute the concept.[6] In addition, the Ballmer Peak has been the subject of satirical academic studies, including a 2024 paper presented at SIGBOVIK, a satirical computer science conference organized by Carnegie Mellon students,[7] which caught broader attention in the programming community.[8] That study, which tested blood alcohol levels of only one male subject tackling competitive computer programming questions, found no evidence of a sudden "peak" of programming ability but did generally find that speed of solving the challenges increased with some alcohol consumption before a rapid decline.[7]

By the time of Ballmer's 2013 announcement of his retirement from Microsoft, the concept of the "Ballmer Peak" was entrenched enough that media joked that the actual Ballmer Peak was the resulting jump in stock price.[9]

References

  1. ↑ "Ballmer Peak". xkcd. Retrieved 2023-10-07.
  2. 1 2 "Microsoft's Steve Ballmer was once Bill Gates' assistant, now he's the 6th richest person in the world. Here are his 5 tips for success". Fortune. Retrieved 2024-04-21.
  3. ↑ "323: Ballmer Peak - explain xkcd". www.explainxkcd.com. Retrieved 2023-10-07.
  4. ↑ Taylor, Colleen (2012-05-08). "Inside The Ballmer Peak-a-thon: The Boozy Hackathon With No Biz Guys Allowed [TCTV]". TechCrunch. Retrieved 2024-05-03.
  5. ↑ "Bottoms Up: The Ballmer Peak Is Real, Study Says". Observer. 2012-04-13. Retrieved 2023-10-07.
  6. ↑ Brabrand, Claus; Inie, Nanna; Tell, Paolo (2024-04-01). "Programming under the influence: On the effect of Heat, Noise, and Alcohol on novice programmers". Journal of Systems and Software. 210 111887. doi:10.1016/j.jss.2023.111887. ISSN 0164-1212.
  7. 1 2 Stone, Twm; Stoddart, Jaz (2024). "The Ballmer Peak: An Empirical Search". arXiv:2404.10002 [cs.SE].
  8. ↑ Chen, Raymond (2024-04-16). "In search of the Ballmer Peak, and other results from SIGBOVIK 2024". The Old New Thing. Retrieved 2024-04-21.
  9. ↑ O'Dell, J. (2013-08-24). "This week in tech stock: Microsoft scales Ballmer Peak one last time". VentureBeat. Retrieved 2024-05-03.
The Daily Front Page 29 of 31
Wednesday, September 30, 2026 The Daily Front No. #260930 — Also on the Front Page
The Daily Front Page 30 of 31
Wednesday, September 30, 2026 The Daily Front No. #260930 — Colophon

That's the Front for Today

Issue No. #260930 — Wednesday, September 30, 2026 — went to press 2026-10-01 at 04:46 UTC.

About This Magazine

The Daily Front is a daily digital magazine assembled from the stories that reached the front page of Hacker News on Wednesday, September 30, 2026. Headlines, points, and comment counts are recorded as they stood at press time. All articles remain the property of their original authors — every piece links back to its source and its discussion thread.

How It Was Made

Fetched, cleaned, and typeset by an automated pipeline. An editor model laid out the pages and chose the highlights; a second read a handful of the day's stories and briefed the cover illustrator — 33 model calls and 250k tokens in total. Set in Jacquard 12, Playfair Display, Source Serif 4, and IBM Plex Mono, all served via Google Fonts under the SIL Open Font License.

The Cover

The cover illustration was commissioned with this prompt:

Inside a converted Polish coal-fired power station, a lone engineer in a hard hat turns a rusted handwheel beside towering racks of humming frontier-computing machines. Their cooling pipes run dry toward an almost empty water tank, while outside, through the open turbine-hall doors, an idle gas tanker sits beneath a cold sky. On the concrete floor, a small unmanned boat lies among scattered fuel drums and black coal dust, linking the thirsty new machinery to distant disrupted supply routes.

Japanese ink-wash minimalism on warm handmade paper: place the lone hard-hatted engineer as the single carefully positioned subject, turning a rusted handwheel beside sparse towering racks of frontier-computing machines; reduce dry cooling pipes, an almost empty water tank, open turbine-hall doors, idle gas tanker beneath a cold sky, and the small unmanned boat among fuel drums and coal dust to a few restrained symbolic forms that preserve their connections. Use only a few dry-brush marks, expansive untouched space, and a deliberate palette of soot black, iron gray, muted rust, desaturated blue, and a single ochre accent.

Absolutely no text, letters, numbers, readable symbols, or logos anywhere in the image. Keep the main image subject primarily below the upper 10% of the composition, where a title may be overlaid; the scene may extend naturally underneath that title area.

Production Ledger

StageModelCallsTokens InTokens Out
extractgpt-5.6-luna 29 146,100 78,229
layoutgpt-5.6-terra 1 19,355 2,234
covergpt-5.6-luna 2 1,550 413
covergpt-image-2.5-flare 1 283 1,372

The Publisher

Published by Johnny.

Support the Press

If The Daily Front brightens your morning, consider supporting its publisher.

Credits & Contact

All content — articles, posts, comments, and the images within them — belongs to its original authors and is reproduced here to point readers back to the source. Full credit goes to those creators; every item links to its original and its Hacker News discussion.

If you are an author and would like your content removed from an issue, write to hi@johnnys.page and it will be taken down.

Feedback is always welcome at the same address: hi@johnnys.page.

Credit where credit is due.

Every page of this issue began as someone else's work — these are the original sources, linked in full.

  1. Gemini 4 Argon by bradleyg223 — blog.google·HN discussion ↗
  2. You said no MCP by yarapavan — earendil.com·HN discussion ↗
  3. September 2026: The world today, as seen by one Polish guy by marjancek — tomwojcik.com·HN discussion ↗
  4. The AI Race Just Got Awkward by allisdust — insufferable.dev·HN discussion ↗
  5. Why Is Sam Altman a Free Man? by ragall — prospect.org·HN discussion ↗
  6. A brief history of the Bloomberg terminal by rbanffy — spectrum.ieee.org·HN discussion ↗
  7. EDG C++ front-end goes public by iandinwoodie — edgcpp.org·HN discussion ↗
  8. The top secret URSALA, RAQUEL, and FARRAH satellites (2025) by Bluestein — thespacereview.com·HN discussion ↗
  9. What TLA+ can and can't check by b-man — buttondown.com·HN discussion ↗
  10. Tesla takes on $30B in credit as it approaches unprofitability by ciconia — electrek.co·HN discussion ↗
  11. LinkedIn Larpmaxxing by BurnerBurner — hereticpleb.vercel.app·HN discussion ↗
  12. SDF vs. MSDF vs. Slug: GPU Text Rendering by ibobev — alphapixeldev.com·HN discussion ↗
  13. Surprisingly complex waves reveal the brain's inner workings by ibobev — quantamagazine.org·HN discussion ↗
  14. 5x faster Edge Functions: V8 isolates to Firecracker MicroVMs by jbott — netlify.com·HN discussion ↗
  15. CS240 AI Cheating Retrospective by ArchAndStarch — turkeyland.net·HN discussion ↗
  16. Gemini 4 Argon (High): Intelligence, Performance and Price Analysis by theanonymousone — artificialanalysis.ai·HN discussion ↗
  17. Halfspace experimental IDE for solid modeling with distance fields by luu — mattkeeter.com·HN discussion ↗
  18. Dear Software Makers by speckx — blog.jim-nielsen.com·HN discussion ↗
  19. PSSA: A non-transformer language model written from scratch in Rust by sparticle62 — github.com·HN discussion ↗
  20. Responsible Release of AI-Generated Mathematics by aureianimus — agmai.org·HN discussion ↗
  21. Singapore govt dating app uses Gale-Shapley stable marriage algorithm by rzk — twitter.com·HN discussion ↗
  22. Launch HN: Magnitude (YC S25) – Self-optimizing inference engine for agents by anerli — github.com·HN discussion ↗
  23. Most data centers refusing to say how much water, electricity they use by Thom2503 — nltimes.nl·HN discussion ↗
  24. The last time my family was replaced by technology by megalomanu — manuel.darcemont.fr·HN discussion ↗
  25. RSS Feeds for Last.fm by Baljhin — lfm.xiffy.nl·HN discussion ↗
  26. Commit description as a thinking tool by yedhukrishnan — yedhu.me·HN discussion ↗
  27. Ballmer Peak by thunderbong — en.wikipedia.org·HN discussion ↗
  28. 56k.rip – the 1996 dial-up internet experience by adunk — 56k.rip·HN discussion ↗
  29. America.gov goes crazy on "play Minecraft" by thoughtfullyso — america.gov·HN discussion ↗
  30. SDF Public Access Unix System ... est. 1987 by kmstout — sdf.org·HN discussion ↗

Browse all issues in the archive →